

Apple Music vs Spotify royalty pay rates is the comparison every label finance lead runs before routing priority campaigns—but headline "RPM" numbers mislead without territory, subscriber tier, and contractual context. Apple Music and Spotify use different pool mechanics, report on different cycles, and skew toward different geographies. A track that earns forty-five hundred dollars on Spotify and thirty-two hundred on Apple from similar stream counts is not unusual.
This analysis compares reported pay averages, structural drivers, and when to weight each platform in release strategy.

Compare platforms on net dollars and audience fit—not folklore RPM quotes.
RPM vs Net Receipts
RPM—revenue per thousand streams—is a derived average: total master royalties divided by streams times one thousand. It varies month to month with pool size, stream inflation, and listener country mix. Treat published industry RPM ranges as directional, not contractual guarantees.
Net receipts after distributor and label splits matter more than platform gross RPM for artist wallets.
Apple Music vs Spotify RPM Ranges (Indicative)
| Metric | Spotify (Premium-heavy) | Apple Music | Notes |
|---|---|---|---|
| US master RPM band | $3.50 – $5.50 | $6.00 – $10.00 | Varies by label deals |
| EU major market RPM | $2.80 – $4.80 | $5.00 – $8.50 | Currency FX impacts |
| Global blended indie | $2.50 – $4.00 | $4.50 – $7.50 | Geo mix dependent |
| Ad-supported share | Significant on Spotify | Minimal on Apple | Skews Spotify down |
| Statement cadence | Monthly typical | Monthly typical | Distributor dependent |
| Discovery engine | Strong algorithmic | Editorial + library | Strategy differs |
Sources aggregate distributor reports; your mileage varies. Log actual statements per release to build internal truth.
RPM Comparison Bar Chart
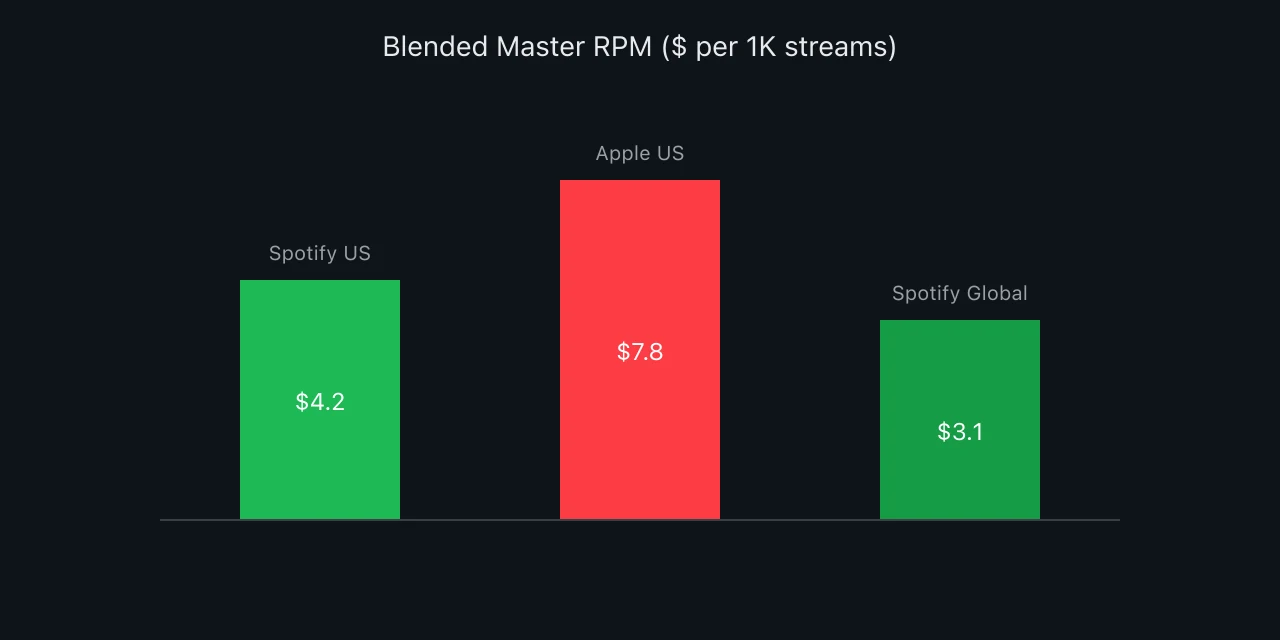
Apple vs Spotify RPM bars
Apple Music often shows higher master RPM in premium-heavy markets; Spotify wins on volume and discovery scale.
Structural Drivers of the Gap
Spotify's larger ad-supported tier pulls blended averages down for many catalogs. Apple Music remains predominantly subscription-based in most territories. Spotify's total stream denominator grows faster, diluting pro rata shares even when pools grow.
According to Apple Music's subscription model, premium-only positioning historically produced higher per-stream master payouts in US analyses—before counting Apple's different label negotiation history.
When Spotify Wins Total Dollars
Higher stream volume from algorithmic discovery often offsets lower RPM. A hip-hop single with three million Spotify streams and eight hundred thousand Apple streams frequently nets more master revenue on Spotify despite lower per-thousand rate.
Pop and rap targeting teens skew Spotify; adult contemporary and legacy rock catalogs sometimes show Apple share disproportionate to stream count.
When Apple Music Wins Total Dollars
Catalogs with strong US, UK, Canada, and Australia presence and older affluent demographics can see Apple contribute thirty to forty percent of master streaming revenue on twenty percent of streams. Prioritize Apple editorial pitching when data shows that skew.
Geo-Weighting Method for Forecasts
Export territory stream share per platform from distributors. Multiply streams by internal RPM priors per territory. Sum platforms. Compare to single global RPM guess—variance often exceeds twenty percent.
Playlist and Editorial Ecosystem Differences
Spotify's third-party playlist economy drives volume; Apple's editorial gates are narrower but high-intent. Payoff per playlist add differs—measure saves and Apple library adds separately.
Artist Relations and Data Access
Spotify for Artists offers granular source-of-stream data; Apple Music for Artists improved but remains less granular for some indie users. Operational strategy often centers Spotify because data enables faster iteration—even when Apple pays more per play.
Case Study: Dual-Platform Folk Artist
A folk artist's twelve-month data: Spotify sixty-two percent of streams, fifty-one percent of master revenue. Apple twenty-three percent of streams, thirty-eight percent of revenue. YouTube and others filled the gap. Campaign strategy shifted: maintain Spotify discovery tests while pursuing Apple editorial and AAA radio cross-pitch for RPM-rich listeners.
Major Label Negotiations vs Indie
Majors may have different effective rates via advances and equity arrangements invisible to indie comparisons. Do not expect indie DistroKid statements to match major label SEC narrative averages.
Future Rate Pressure
Stream inflation, price increases, and bundling (family plans, telco deals) all shift pools. Model sensitivity: plus ten percent subscribers with plus fifteen percent total streams is a plausible stress test annually.
Practical Marketing Allocation Guidance
Do not starve either platform. Default seventy percent effort Spotify / thirty percent Apple for global indie pop; flip toward fifty-five / forty-five for US heritage acts. Always let last twelve months statements override defaults.
Comparison Mistakes to Avoid
Quoting one viral tweet RPM. Use your statements.
Ignoring ad tier on Spotify. Blended vs premium-only differs.
Comparing gross to net. Label splits distort.
Assuming Apple streams are "bonus." They may be core revenue.
Apple vs Spotify Summary
Apple Music vs Spotify royalty pay rates favor Apple on many premium RPM comparisons; Spotify wins on scale, discovery, and total dollars for most growing indies. Build territory-weighted forecasts, chart both platforms monthly, and allocate pitches where net receipts—not Twitter myths—point you.
Subscriber ARPU Comparison
Average revenue per user differs by platform pricing, bundle deals, and regional mix. Apple Music's historical premium positioning in many markets produced higher ARPU per active listener in analyst models—one driver of higher master payouts per stream in US data sets.
Stream Count Reporting Differences
Minimum play length thresholds and offline play reporting differ slightly between platforms. Comparing raw stream counts one-to-one across DSPs is approximate; compare dollars and territory mix for decisions.
Discovery Value on Spotify
Lower RPM on Spotify may still produce higher lifetime value when algorithmic discovery converts strangers into followers who stream your next five releases. Model LTV, not single-month RPM, when allocating marketing.
Apple Editorial Pitching ROI
Apple Music editorial placements can produce concentrated high-RPM streams from US, UK, Canada, Australia. Track Apple library adds and Shazam tags alongside streams when evaluating pitch ROI.
Spatial Audio and Premium Narratives
Apple marketed spatial and lossless tiers; engagement effects on royalties are subtle but premium brand alignment attracts audiophile listeners who complete tracks and save at higher rates—secondary RPM effects through behavior, not rate cards.
Building Internal RPM Table
Each quarter, export top twenty tracks from distributor: Spotify streams, Spotify revenue, Apple streams, Apple revenue. Compute actual RPM per track. Median your internal table—more accurate than blog posts for your specific catalog geo skew.
Artist Communication Template
When artists ask why Apple pays more per stream but Spotify pays more total, show two-bar chart: RPM and total dollars side by side. Transparency reduces platform loyalty arguments that waste manager time.
Sync and Download Revenue Outside RPM
Apple ecosystem users may purchase more downloads or iTunes sync licenses in legacy workflows—outside streaming RPM but part of platform value. Full platform strategy includes non-stream revenue where applicable.
YouTube and TikTok Context
RPM comparisons often ignore YouTube Content ID and TikTok commercial library payouts. Full digital picture includes three DSPs plus UGC. Apple and Spotify comparison is one slice—present full pie in artist royalty reviews.
Playlist Culture and Streaming Hours
Spotify users historically stream more hours per month in some demographics—more streams per user can dilute pro rata share even when ARPU is competitive. Behavioral differences matter as much as sticker subscription price.
Family Plan Streaming Behavior
Family plans on both platforms increase streams per subscription dollar. Apple and Spotify family tiers may skew differently by demographic—young households stream more hours. RPM comparisons should note household plan prevalence in each platform's subscriber mix when such data is available from industry reports.
Classical and Jazz Platform Skews
Classical and jazz catalogs sometimes earn disproportionate Apple share relative to streams—audiophile and older listener skew. Genre-specific platform strategy beats one-size allocation for these rosters.
Direct Artist Upload Statements
Artists using DistroKid or TuneCore see per-platform revenue lines—use twelve months of lines to compute personal Apple versus Spotify effective rates. Published industry averages are noisy; personal statements are ground truth.
Marketing Spend Efficiency by Platform
Compute cost per thousand streams and cost per dollar of royalty returned by platform from paid campaigns. Spotify may cost less per stream acquired; Apple may return more per stream organically—efficiency matrix guides split.
Long-Term Catalog Platform Mix
Catalog tracks five years old may show stable Apple RPM premium while Spotify provides volume—revenue mix stabilizes differently than frontline singles. Retirement planning for masters can use platform mix in valuation models.
Quarterly Platform Mix Review
Every quarter, chart dollars and streams per platform for entire catalog. If Apple share of dollars exceeds share of streams by more than ten points, increase Apple pitching resources next quarter—data-driven allocation beats platform politics.
Student Plan Effects
Student discounts on both platforms lower effective ARPU but grow future loyal listeners. Short-term RPM may dip while long-term follower value rises—model multi-release LTV not single-month RPM when targeting students.
Hi-Res and Audiophile Narrative
Apple hi-res marketing attracts listeners who complete tracks—behavioral completion may indirectly sustain algorithmic streams even when RPM discussion focuses on subscription price alone.
Bundled Subscription Attribution
Telco and hardware bundles attribute subscriber revenue differently across platforms. Effective RPM for bundled listeners may differ from direct subscribers—advanced finance teams segment when distributors expose bundle flags.
Cross-Platform Playlist Strategy
Spotify playlist success does not automatically translate to Apple Music editorial interest—pitch both with platform-native narratives. Apple pitches highlighting lossless masters and spatial mixes where applicable; Spotify pitches highlighting save velocity and completion.
Royalty Statement Education Sessions
Quarterly artist education webinars comparing Apple versus Spotify lines on real anonymized statements reduce support load and align expectations. Education is cheaper than dispute resolution.
Emerging Market Platform Split
Emerging markets may show Spotify dominance in streams while Apple devices skew premium in urban pockets—segment Lagos, São Paulo, Jakarta separately before global RPM conclusions. City-level nuance beats country averages for touring and promo.
Vinyl and Streaming Bundle Fans
Fans buying vinyl often stream on Apple in hi-fi setups—cross-merch campaigns can shift platform mix toward higher RPM cohorts without losing Spotify discovery funnel.
Annual Artist Platform Report
Each January deliver artists personalized platform report: streams, dollars, RPM, trend arrow. Apple Music vs Spotify story becomes their story—not industry abstract debate.
Distributor Line Item Analysis
Sort distributor CSV by Apple revenue per row descending—identify which tracks skew Apple-rich. Pitch those tracks' sonic profiles to Apple editorial while Spotify campaigns continue for volume tracks—split strategy per song, not just per platform.
Break-Even Stream Math by Platform
Compute break-even streams for recoupment separately using platform-weighted RPM. A ten-thousand-dollar advance recoups faster when Apple share of revenue exceeds Apple share of streams—include in artist forecast decks.
Platform-Agnostic Fan Strategy
Fans choose platforms for UX reasons—pressuring fans to switch platforms for artist RPM hurts relationships. Optimize each platform's economics without shaming listeners on their preferred app.
Apple Spotify Five Year View
Chart five-year platform mix trends for catalog—some artists see Apple revenue share rise as fans age into premium iOS households. Longitudinal view beats single-release platform arguments during contract renewals.
Playlist Curator Platform Preference
Some curators primarily use Spotify for pitching workflows even when they personally listen on Apple—pitch format should match curator workflow, not artist platform preference.
RPM in Artist Contract Exhibits
Avoid guaranteeing RPM in contracts—instead attach explanatory exhibit on pro rata variability. Lawsuits start when guaranteed pennies do not match pooled reality.
Cross-Platform Reporting for Managers
Managers report both platforms in monthly artist emails: streams, dollars, RPM, one sentence interpretation. Habitual reporting prevents platform surprise arguments at album cycle end.
Territory Manager Platform Split
Assign territory managers platform focus where data supports it—US agent emphasizes Apple editorial paths when Apple dollars exceed Spotify dollars for their territory even if global streams favor Spotify.
Apple Spotify Summary Table Review
Revisit indicative RPM table every January with fresh distributor exports—your internal table should replace blog estimates within two years of consistent logging.
Apple Spotify Closing
Apple Music vs Spotify royalty pay rates comparison ends with your data: log both platforms monthly, allocate pitches accordingly, and teach artists that total dollars and platform fit beat arguing single RPM screenshots.
Weighted RPM Spreadsheet
Build spreadsheet tab per release with platform stream share and platform dollar share—weighted RPM column updates automatically when new distributor CSV imports land each month.
Apple Spotify Pay Rates Final
Apple Music vs Spotify royalty pay rates: compare with your statements, pitch both strategically, and stop arguing screenshots—operational clarity beats platform tribalism every quarter.
Family Plan and Bundle Dilution
RPM comparisons often ignore how listeners actually pay. Family plans, student discounts, carrier bundles, and promotional trials all change the revenue attached to a single play even when gross subscriber numbers look healthy. Apple and Spotify allocate those plays into their pools differently, which is one reason two artists with identical stream counts can report different dollars on each platform in the same month. When you benchmark Apple Music vs Spotify royalty pay rates internally, tag a sample of statements by listener tier if your distributor exposes it. Over time you will see whether your audience skews toward full-price subscribers on one platform or toward discounted tiers on the other. That skew matters more for long-term forecasting than any public RPM chart copied from a forum post.


