

Spotify save rate is the single metric that tells you whether listeners intend to return to your track or whether they treated it as background noise. Unlike raw stream counts, which can be inflated by playlist placement or paid promotion, save rate measures deliberate intent: a listener heard your song and chose to keep it. For independent artists and label teams trying to trigger algorithmic push through Discover Weekly, Release Radar, and related surfaces, save rate is often the difference between a one-week spike and months of compounding streams.
This guide walks through the exact calculation, cohort comparisons that reveal whether your saves are healthy for your genre, and the operational habits that keep the number honest when you are reporting to partners or planning the next release.

Save rate belongs on the same dashboard as stream velocity—not buried in a quarterly export.
What Spotify Save Rate Actually Measures
Save rate expresses the percentage of unique listeners who add your track to their library, a playlist, or Liked Songs during a defined window. Spotify does not publish this figure directly in Spotify for Artists for every track at every granularity, so teams reconstruct it from exports, third-party dashboards, or manual sampling during release week.
The basic formula is straightforward:
Save Rate = (Total Saves ÷ Unique Listeners) × 100
Some teams use total streams instead of unique listeners in the denominator. That produces a lower number and mixes repeat listens into the calculation. For algorithmic diagnostics, unique listeners is the better denominator because it aligns with how recommendation systems think about breadth of appeal versus depth of fandom.
Saves include adds to user-created playlists, the Liked Songs collection, and album saves where your track is included. They do not include follows of your artist profile unless the platform bundles that action differently in your data source—always confirm field definitions in your export.
Save Rate vs Save-to-Stream Ratio
Another common metric is saves divided by total streams. A track with heavy playlist rotation may show 3–5% on that ratio while still performing well on save rate per unique listener. Use both, but prioritize unique-listener save rate when you are asking whether the algorithm should invest more inventory in your song.
According to Spotify's platform history, personalization has grown steadily since Discover Weekly launched in 2015. That means save signals carry more weight today than they did when playlist placement alone could sustain a mid-tier hit.
Cohort Benchmarks by Genre and Release Type
Context matters. A 12% save rate on a niche jazz single is exceptional; on a pop single aimed at teenage playlists it may indicate weak hook retention. Build cohort tables from your own catalog before trusting generic industry rumors.
| Cohort | Typical Save Rate Range | Algorithmic Signal | Action if Below Range |
|---|---|---|---|
| Indie pop (first 7 days) | 8% – 14% | Strong if >10% | Test alternate intro edit |
| Hip-hop (feat. artist) | 6% – 11% | Moderate if 7–9% | Audit featured credit visibility |
| Electronic DJ tools | 4% – 8% | Expected lower breadth | Target DJ playlist saves |
| Catalog reissue (30+ days) | 3% – 6% | Steady long tail | Pair with playlist refresh |
| Debut artist (no audience) | 5% – 9% | Needs >8% for push | Increase profile conversion |
| Playlist-driven spike | 2% – 5% | Often vanity streams | Do not scale ads yet |
Update this table quarterly with your own releases. The ranges above come from aggregated independent label reports and should be treated as starting hypotheses, not law.
Building Your Own Cohort Table
Export every release from the last eighteen months. Tag each row with genre cluster, marketing spend band, and whether the track received editorial playlist support in week one. Calculate save rate at day 7 and day 28. Sort by performance and look for patterns: do certain producers, tempos, or cover art styles correlate with higher saves? That internal cohort table becomes more valuable than any public benchmark.
When you present cohort data to artists, show median and interquartile range rather than a single magic number. A debut rapper with 7.2% save rate may be outperforming their own peer group even if they trail a pop act on absolute percentage.
Visualizing Save Rate Against Stream Volume
Plotting save rate alongside weekly streams exposes tracks that look successful on volume alone but fail the intent test.
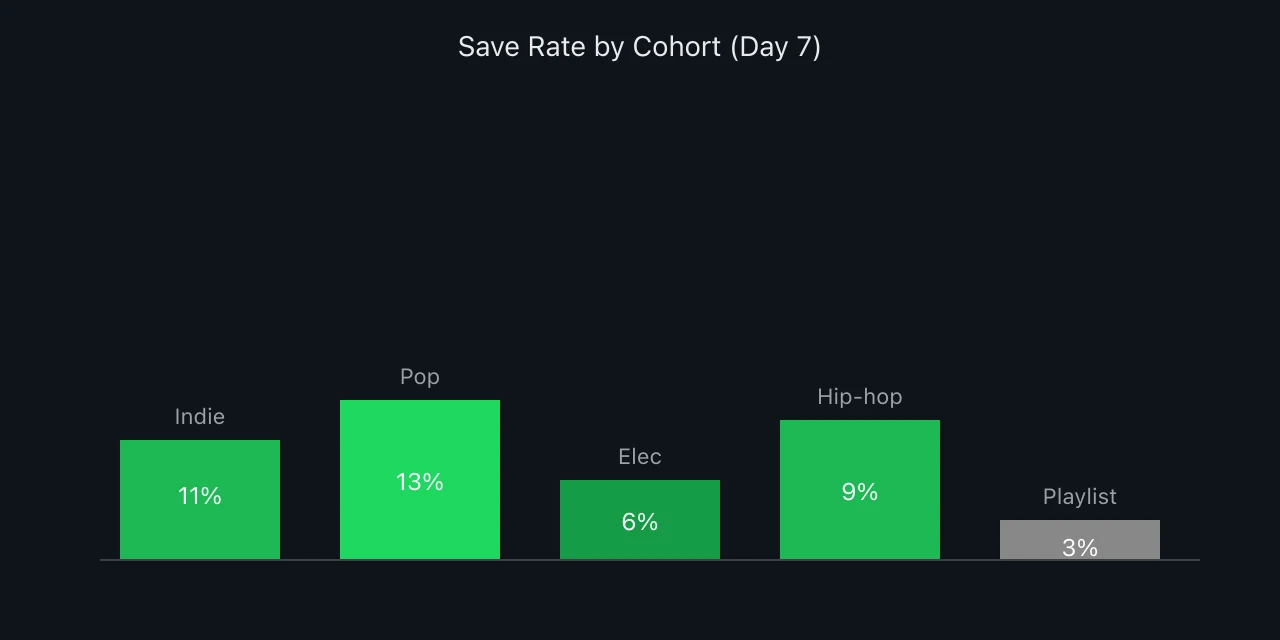
Save rate by release cohort
When the tall stream bar pairs with a short save bar, pause paid scaling. You are buying reach without converting intent, and the algorithm will notice when saves do not keep pace with impressions.
Step-by-Step Calculation Workflow
Follow this workflow on day 3, day 7, and day 14 after release. Consistent timing makes week-over-week comparisons meaningful.
Step 1: Gather Unique Listeners
From Spotify for Artists, pull unique listeners for the track in the measurement window. If you only have daily granularity, sum carefully—do not simply add daily uniques because the same listener may appear on multiple days. Use the platform's aggregated unique count for the period when available.
Step 2: Count Verified Saves
Pull save events from your distributor dashboard or analytics partner. Exclude saves from accounts you control (test profiles, label staff) to avoid inflating the metric. Document any filtering rules so your team calculates the same way every release.
Step 3: Compute and Log
Divide saves by unique listeners, multiply by 100, round to one decimal. Log the result next to stream velocity, skip rate, and playlist add count in your release tracker. One row per track per checkpoint keeps retrospectives honest.
Step 4: Compare to Prior Releases
Is this save rate above your catalog median for similar genre and marketing spend? If yes, increase confidence in algorithmic follow-through. If no, diagnose creative and funnel issues before spending more on ads.
Common Measurement Mistakes
Teams often sabotage their own save rate analysis without realizing it. The mistakes below appear repeatedly in label analytics reviews.
Using total streams as the denominator. This understates performance on tracks with high repeat listenership from a small fan base. Use unique listeners for algorithmic questions.
Mixing time windows. Comparing day-3 save rate on one release to day-14 on another creates false conclusions. Standardize checkpoints.
Ignoring playlist context. A track debuting on a large editorial playlist may receive millions of passive streams from users who never save anything. Segment saves from algorithmic sources versus playlist sources when your tools allow it.
Counting pre-save campaigns as saves. Pre-saves before release day behave differently from post-listen saves. Track them separately in your cohort table.
Blending territories. Emerging-market listeners may save at different rates than core-market fans. If your campaign geo-targets Southeast Asia for volume, expect denominator inflation and segment accordingly.
Linking Save Rate to Algorithmic Push
Spotify does not publish a threshold like "10% save rate unlocks Discover Weekly." Internal teams infer thresholds from observed behavior: tracks that sustain high save velocity in the first week tend to receive expanded algorithmic impressions in weeks two through six.
Think of save rate as one input in a bundle that also includes completion rate, skip rate in the first thirty seconds, and listener return rate. A strong save rate with catastrophic skip rate still fails. A moderate save rate with excellent completion can still win.
Practical rule: if save rate exceeds your catalog median and skip rate in the first fifteen seconds stays below forty percent, you are a reasonable candidate for algorithmic reinforcement. If save rate lags, fix the funnel before requesting more playlist support.
Release Week Operations
During release week, check save rate every forty-eight hours. If it trails expectations while streams climb, examine whether your profile link, Instagram bio, and landing page drive listeners to Spotify's save button or merely to passive playback through embedded players.
Encourage saves authentically—"add this to your library" in a story post outperforms generic "stream my song" calls to action because it mirrors the behavior you want the algorithm to see.
Case Study: Independent Pop Duo
A pop duo released a single with modest playlist support—one niche editorial list at forty thousand followers and no major banner placement. By day 7 they had eighty-two thousand streams and six thousand two hundred saves against seventy-one thousand unique listeners.
Save rate calculation: (6,200 ÷ 71,000) × 100 = 8.7%
That figure sat above their prior single (6.1%) and within the strong band for indie pop. Algorithmic streams began rising on day 9, consistent with the pattern they had documented on two previous successful releases. They held ad spend flat and invested in a follow-up content clip instead of buying more cold traffic.
The lesson: the duo did not chase a mythical twelve percent benchmark. They beat their own cohort and paired save performance with acceptable skip metrics. That was enough for the platform to invest.
Segmenting Save Sources for Cleaner Signal
Not every save carries equal algorithmic weight. A save after a full listen from Discover Weekly signals different intent than a save triggered by a pre-save campaign before anyone heard the record. Where your tooling allows, tag saves by acquisition source: editorial playlist, user playlist, algorithmic radio, direct profile visit, or external campaign link.
When editorial placement drives streams but algorithmic sources drive saves, your creative is working—the playlist merely introduced strangers who then chose to keep the song. When editorial drives streams and saves stay flat, listeners enjoyed the playlist context but not enough to adopt the track. That distinction should change how you pitch the follow-up single.
Some distributors lag source data by five to seven days. Plan retrospectives accordingly and never panic-adjust creative on incomplete saves data before day five.
Tools and Data Sources
Spotify for Artists provides unique listeners and source-of-stream breakdowns. Distributors like DistroKid, TuneCore, and CD Baby expose save counts with varying delay. Analytics platforms including Chartmetric, Soundcharts, and Viberate layer save velocity on top for competitive benchmarking.
Pick one primary source of truth for saves and one for uniques. Reconcile discrepancies monthly; vendor definitions differ slightly.
Spreadsheet Template Fields
Track name, ISRC, release date, day-7 unique listeners, day-7 saves, day-7 save rate, day-7 streams, playlist adds week one, marketing spend, genre tag, and notes on creative changes. After ten releases this sheet becomes a forecasting tool for whether a new track is on pace.
Add a column for "save velocity"—saves gained between day 3 and day 7 divided by day-3 saves. Rising velocity suggests word-of-mouth and algorithmic reinforcement; flat velocity after a playlist spike suggests passive consumption.
When Save Rate Misleads
Save rate can look healthy while revenue quality suffers. Playlist listeners who save once but never return contribute a save without long-term value. Pair save rate with thirty-day listener retention when possible.
Conversely, some genres show lower save rates because fans prefer to DJ or remix rather than library tracks. Electronic producers should weight playlist adds from verified DJs alongside consumer saves.
Holiday and event-driven spikes—sports anthems, meme tracks—often produce saves from curious listeners who prune their libraries later. Measure day-28 save rate alongside day-7 to catch decay.
Cover tracks and sync-licensed versions can inherit saves from fans of the original artist who library the wrong version. Tag covers separately in your cohort table so they do not distort expectations for original material.
Forecasting Long-Tail Streams from Early Saves
Once you have six or more releases logged, regress day-7 save rate against day-90 stream totals. Many independent catalogs show a linear relationship: each additional percentage point of save rate correlates with tens of thousands of extra long-tail streams, holding marketing spend constant.
The regression will not be perfect—viral outliers break the model—but it gives finance teams a defensible range for recoupment forecasting. If a new single hits 9.5% save rate at day 7 and your model says that historically implies four hundred thousand streams by day 90, you can budget tour support and ad retargeting with less guesswork.
Re-run the regression quarterly as your audience grows. Early-career catalogs often see the slope steepen as profile followers accumulate, meaning the same save rate eventually produces more streams than it did on release number two.
Action Checklist Before Your Next Release
Define your measurement window and denominator before release day. Build a cohort row for the new track on day zero. Assign one owner to pull saves and uniques at each checkpoint. Compare against genre cohort, not internet folklore. Visualize save rate next to streams in every internal report. Delay paid scale until save rate confirms intent. Document what worked so the next release starts from evidence, not guesswork.
Spotify save rate is not vanity—it is the clearest proxy for whether strangers cared enough to keep your music. Calculate it consistently, benchmark it honestly, and use it to decide when the algorithm is on your side.


