
Here's how to actually do it.
Start With What You Already Have Access To
Before looking for external tools, spend time in the analytics dashboards you already have. Spotify for Artists, Apple Music for Artists, YouTube Studio, Instagram Insights, and TikTok Creator Analytics are all free and collectively contain more useful information than most independent artists ever fully use.
The goal in this first pass isn't to find a single metric that tells you what to do. It's to build a picture of your audience and how they engage with your catalog. Where do your listeners live geographically? What's the age and gender breakdown? Which tracks have the highest save rates versus just play counts? Which songs are getting added to the most user-generated playlists? What percentage of your Spotify listeners follow you versus just finding you through playlists or algorithmic recommendations? These numbers don't tell you what to release – but they tell you who you're releasing to and what's resonating with them, which shapes every decision that follows.
Step 1: Identify Your Audience's Listening Patterns
The when and where of how people listen to your music is more actionable than most artists realize. Spotify for Artists shows you the cities and countries with your highest monthly listener counts. If you're noticing a significant concentration of listeners in a city you haven't played in, that's worth knowing. It might inform a regional release strategy, a playlist pitch targeting that market, or eventually a tour booking decision.
Beyond geography, look at the weekly and daily patterns in your streaming data. Most analytics platforms can show you when during the week your streams peak. For release timing, this matters: releasing on a Friday (the industry standard) makes sense if your audience streams heavily on weekends, but some genres and some artist audiences have midweek engagement patterns that would make a Tuesday or Wednesday release equally effective for building early momentum with their specific listeners.
The platform mix also matters. If 70% of your streams come from Spotify and 20% from Apple Music, a release strategy that focuses playlist pitching effort on Spotify and Apple editorial submissions is clearly the right allocation. If you're seeing unexpectedly strong YouTube numbers on lyric videos or visualizers, that's a signal about where video content is finding traction and worth building into your release campaign.
Step 2: Use Engagement Rate, Not Just Play Count
Play count is the vanity metric of music analytics. It tells you how many times a track started playing, but it doesn't tell you whether people finished it, saved it, shared it, or came back to it. The more meaningful metrics for release decisions are save rate, skip rate, stream-to-follower ratio, and playlist adds.
Save rate – the percentage of listeners who save a track to their library – is one of the strongest signals of genuine connection with a song. Spotify for Artists shows saves, and a track with a high save rate relative to its total streams is a track that's landing differently than one that plays through but doesn't convert to saves. When you're deciding which song to release next or which track to pitch for editorial playlist consideration, a high save rate on a similar song in your back catalog is meaningful evidence.
Skip rate tells you where in a song people are dropping off. If you have access to audience retention data (YouTube provides this clearly; Spotify's data is less granular but still useful), and you're seeing significant drop-off in the first thirty seconds of a track, that's information worth acting on before the next release – either in how you structure your songs or in how you choose which song to lead a campaign with.
Playlist adds by listeners (not editorial placement) indicate organic traction. When listeners are adding your track to their own playlists, it means the song fits naturally into how they organize their listening and they expect to return to it. That behavior is correlated with long-tail streaming performance and is a signal that the track has legs beyond its initial release window.
Step 3: Read Your Social Data Before You Commit to a Format
The content formats you use to promote a release should follow what your specific audience is already engaging with – not what works generically across the platform. If your Instagram Reels consistently outperform your static posts in reach and saves, that's a direct instruction about where to put your creative energy in a release campaign. If your TikTok videos under fifteen seconds get significantly more shares than your sixty-second cuts, that's information about what format carries your content further in that ecosystem.
Before you build your release rollout plan, pull the engagement data on your last ten to fifteen social posts across each platform. What format did best? What content type generated the most saves or shares (not just likes)? Was it a clip of a live performance, a production breakdown, a lyric video, something personal? The patterns you find in that data should directly shape how you allocate your creative energy in the next campaign.
This doesn't mean you should only do what performs well algorithmically – artistic integrity matters and you shouldn't hollow out your content just to chase metrics. But there's usually a way to present what you genuinely want to share in a format that your specific audience responds to. The data helps you find that format.
Step 4: Use Pre-Save and Pre-Release Signals to Forecast Momentum
Pre-save campaigns – where listeners save an upcoming release before it drops so it automatically appears in their library on release day – generate a data signal before the music even comes out. The volume and velocity of pre-saves tells you something about how effectively your promotional content is converting interest into intent. A pre-save campaign that's moving slowly two weeks before release is a signal to either push harder on promotional content or recalibrate expectations about opening-week performance.
Link tracking tools like Toneden, Feature.fm, or Hypeddit let you see not just how many pre-saves you're getting but where they're coming from – which social platform, which specific post or bio link, which collaborator or press outlet drove the most conversion. This attribution data is what separates "I'm getting pre-saves" from "I know that my Instagram Stories are converting at twice the rate of my TikTok, so I should prioritize Instagram in the final push." That precision makes your marketing budget and creative time go further.
Email list response rates are another pre-release signal worth reading. If you're sending a release announcement to your mailing list and the open rate and click-through rate are below your averages, that's useful feedback about either the quality of the email, the level of excitement around this particular project, or both. Your email list is typically your most engaged audience segment, so low response there is worth paying attention to before you roll out the broader campaign.
Step 5: Study the Post-Release Data Window
The first seventy-two hours after a release generate data that's disproportionately useful for understanding what's working and what needs adjustment. Which platform is showing the strongest early uptake? Which social posts about the release are getting the most saves and shares? Where is the traffic to your Spotify artist page or Apple Music profile coming from?
This window also tells you whether Spotify's algorithmic systems are responding to the track. If you see a meaningful spike in listener reach beyond your follower count in the first week, the Release Radar and Discover Weekly algorithms are likely distributing the track – which means the song is getting saves and completes at a rate the algorithm finds favorable. If the reach stays flat at roughly your existing follower count, organic algorithmic distribution isn't happening at scale and you may need to lean harder on direct promotion, playlist pitching, or social content to build momentum.
Don't overreact to the first twenty-four hours. Streaming data stabilizes over the course of a week, and a slow start on release day can catch up significantly over the following days if social content starts converting. Use the seventy-two-hour window to adjust your promotional push, not to judge the release as a success or failure.
Tools That Make Fan Data More Readable
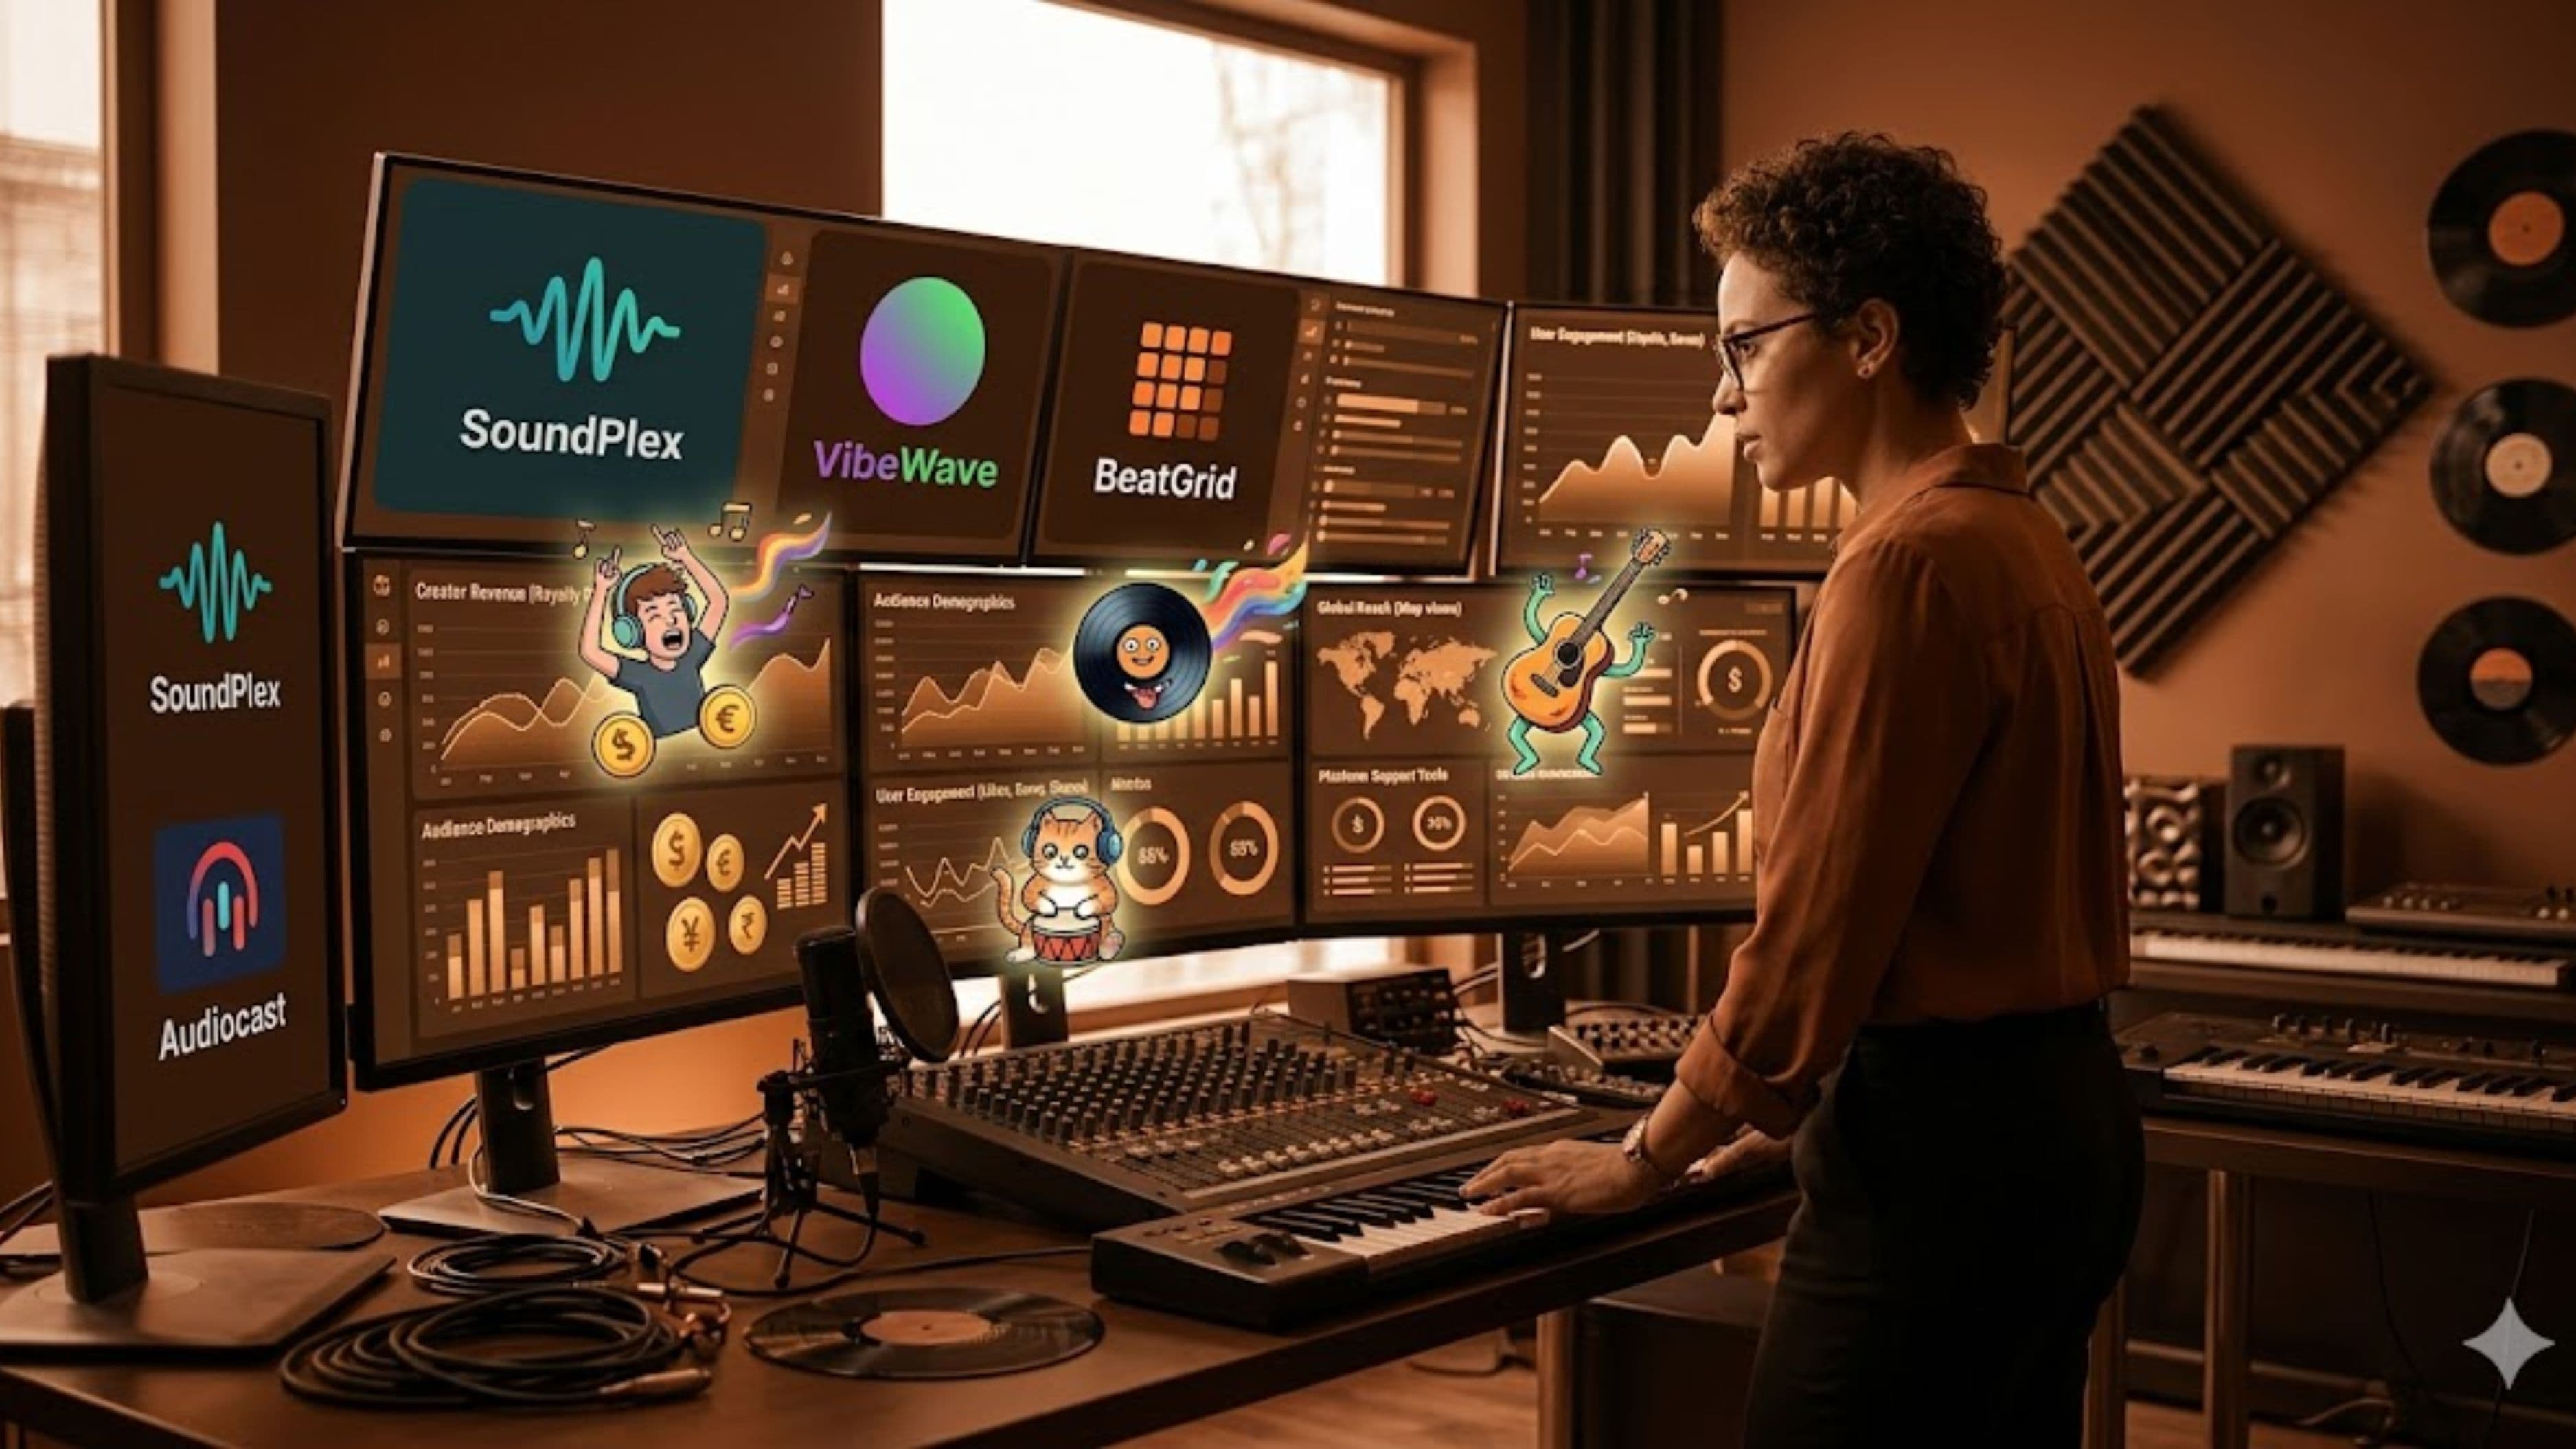
Beyond the native platform dashboards, a few third-party tools aggregate data across platforms and make it easier to see patterns across your full presence.
Chartmetric is the most comprehensive option for independent artists who want cross-platform analytics in one place. It pulls streaming data from Spotify, Apple Music, YouTube, SoundCloud, and more, and shows you trends across your catalog, geographic growth patterns, and playlist performance over time. The free tier is limited but useful for getting started.
Soundcharts is similar and strong on playlist tracking – if you want to monitor which playlists are adding your tracks and measure the streaming impact of each placement, it's purpose-built for that use case.
Spotify for Artists itself has improved significantly and remains the most important single dashboard for most independent artists, particularly for the Audience section that shows geographic breakdown, listener age range, and how listeners found your music.
Bandcamp's analytics are particularly useful for artists selling direct – the platform shows you which tracks are driving purchase decisions, where buyers are located, and which referral sources convert to sales.
What to Watch Out For
The main risk in data-driven release decisions is mistaking correlation for causation. A track that got 50,000 streams in its first week probably had other factors going right – a playlist placement, a viral social post, a press mention – that aren't visible in the raw streaming numbers. Drawing the conclusion that the release strategy was simply "better" without accounting for those external factors leads to false confidence.
Small sample sizes also matter. If you only have three or four prior releases, your historical data doesn't yet give you statistically reliable patterns. Use what you have, but hold the conclusions loosely and continue gathering data over more releases before treating any finding as a firm rule.
Don't let data replace your artistic judgment about what to release. The goal is informed decisions, not algorithmic ones. The data can tell you when, where, and how to release with more precision than gut feeling alone. It can't tell you which of your songs is worth releasing, what your creative vision should be, or what kind of artist you want to become.
FAQ
Which analytics dashboard should I prioritize as an indie artist? Spotify for Artists first, because Spotify still represents the largest streaming share for most artists and the analytics are detailed. YouTube Studio second if you're investing in video content. After those two, your strongest social platform's native analytics. A tool like Chartmetric is worth adding once you have enough history to make cross-platform comparisons meaningful.
How much data do I need before it's useful? More is better, but you can start drawing directional conclusions with three to six months of consistent activity and at least two or three released tracks. Geographic data and platform mix become clear earlier than engagement rate patterns, which need more volume to be reliable.
Should I change my release date based on analytics? If your data shows your audience is heavily active midweek and you've been defaulting to Friday releases, experimenting with a Thursday or Wednesday release is worth testing. Friday releases still benefit from new music editorial playlists on Spotify and Apple Music, which reset on Fridays – that's a real consideration against moving away from the industry standard. But if editorial placement isn't a realistic near-term expectation for a given release, the standard Friday date matters less.
What's a good save rate on Spotify? Industry benchmarks vary, but a save rate of 15–25% of total streams is generally considered strong for independent artists. Above 25% is excellent and indicates the track is genuinely connecting. Below 10% suggests the track is getting plays but not converting listeners into fans who want to return to it.
Can fan data tell me what kind of music to make? It can tell you what's resonating with your current audience, which is useful context – but it shouldn't be the primary driver of your creative decisions. Data can tell you that a certain sonic direction or lyrical theme is connecting more than another. That's useful input. Using it to reverse-engineer what you make from audience metrics tends to produce music that feels calculated rather than genuine, which is usually detectable and ultimately counterproductive.
📚 Sources
Spotify for Artists – Understanding Your Analytics: https://artists.spotify.com/blog/how-to-read-your-spotify-for-artists-data
Chartmetric – Music Analytics Platform Overview: https://chartmetric.com/features
Soundcharts – Playlist Tracking for Artists: https://soundcharts.com/features/playlist-tracker
MusicWatch – Streaming Behavior Research: https://www.musicwatch.com/research-insights/
Feature.fm – Smart Links and Pre-Save Campaigns: https://feature.fm/products/smart-links