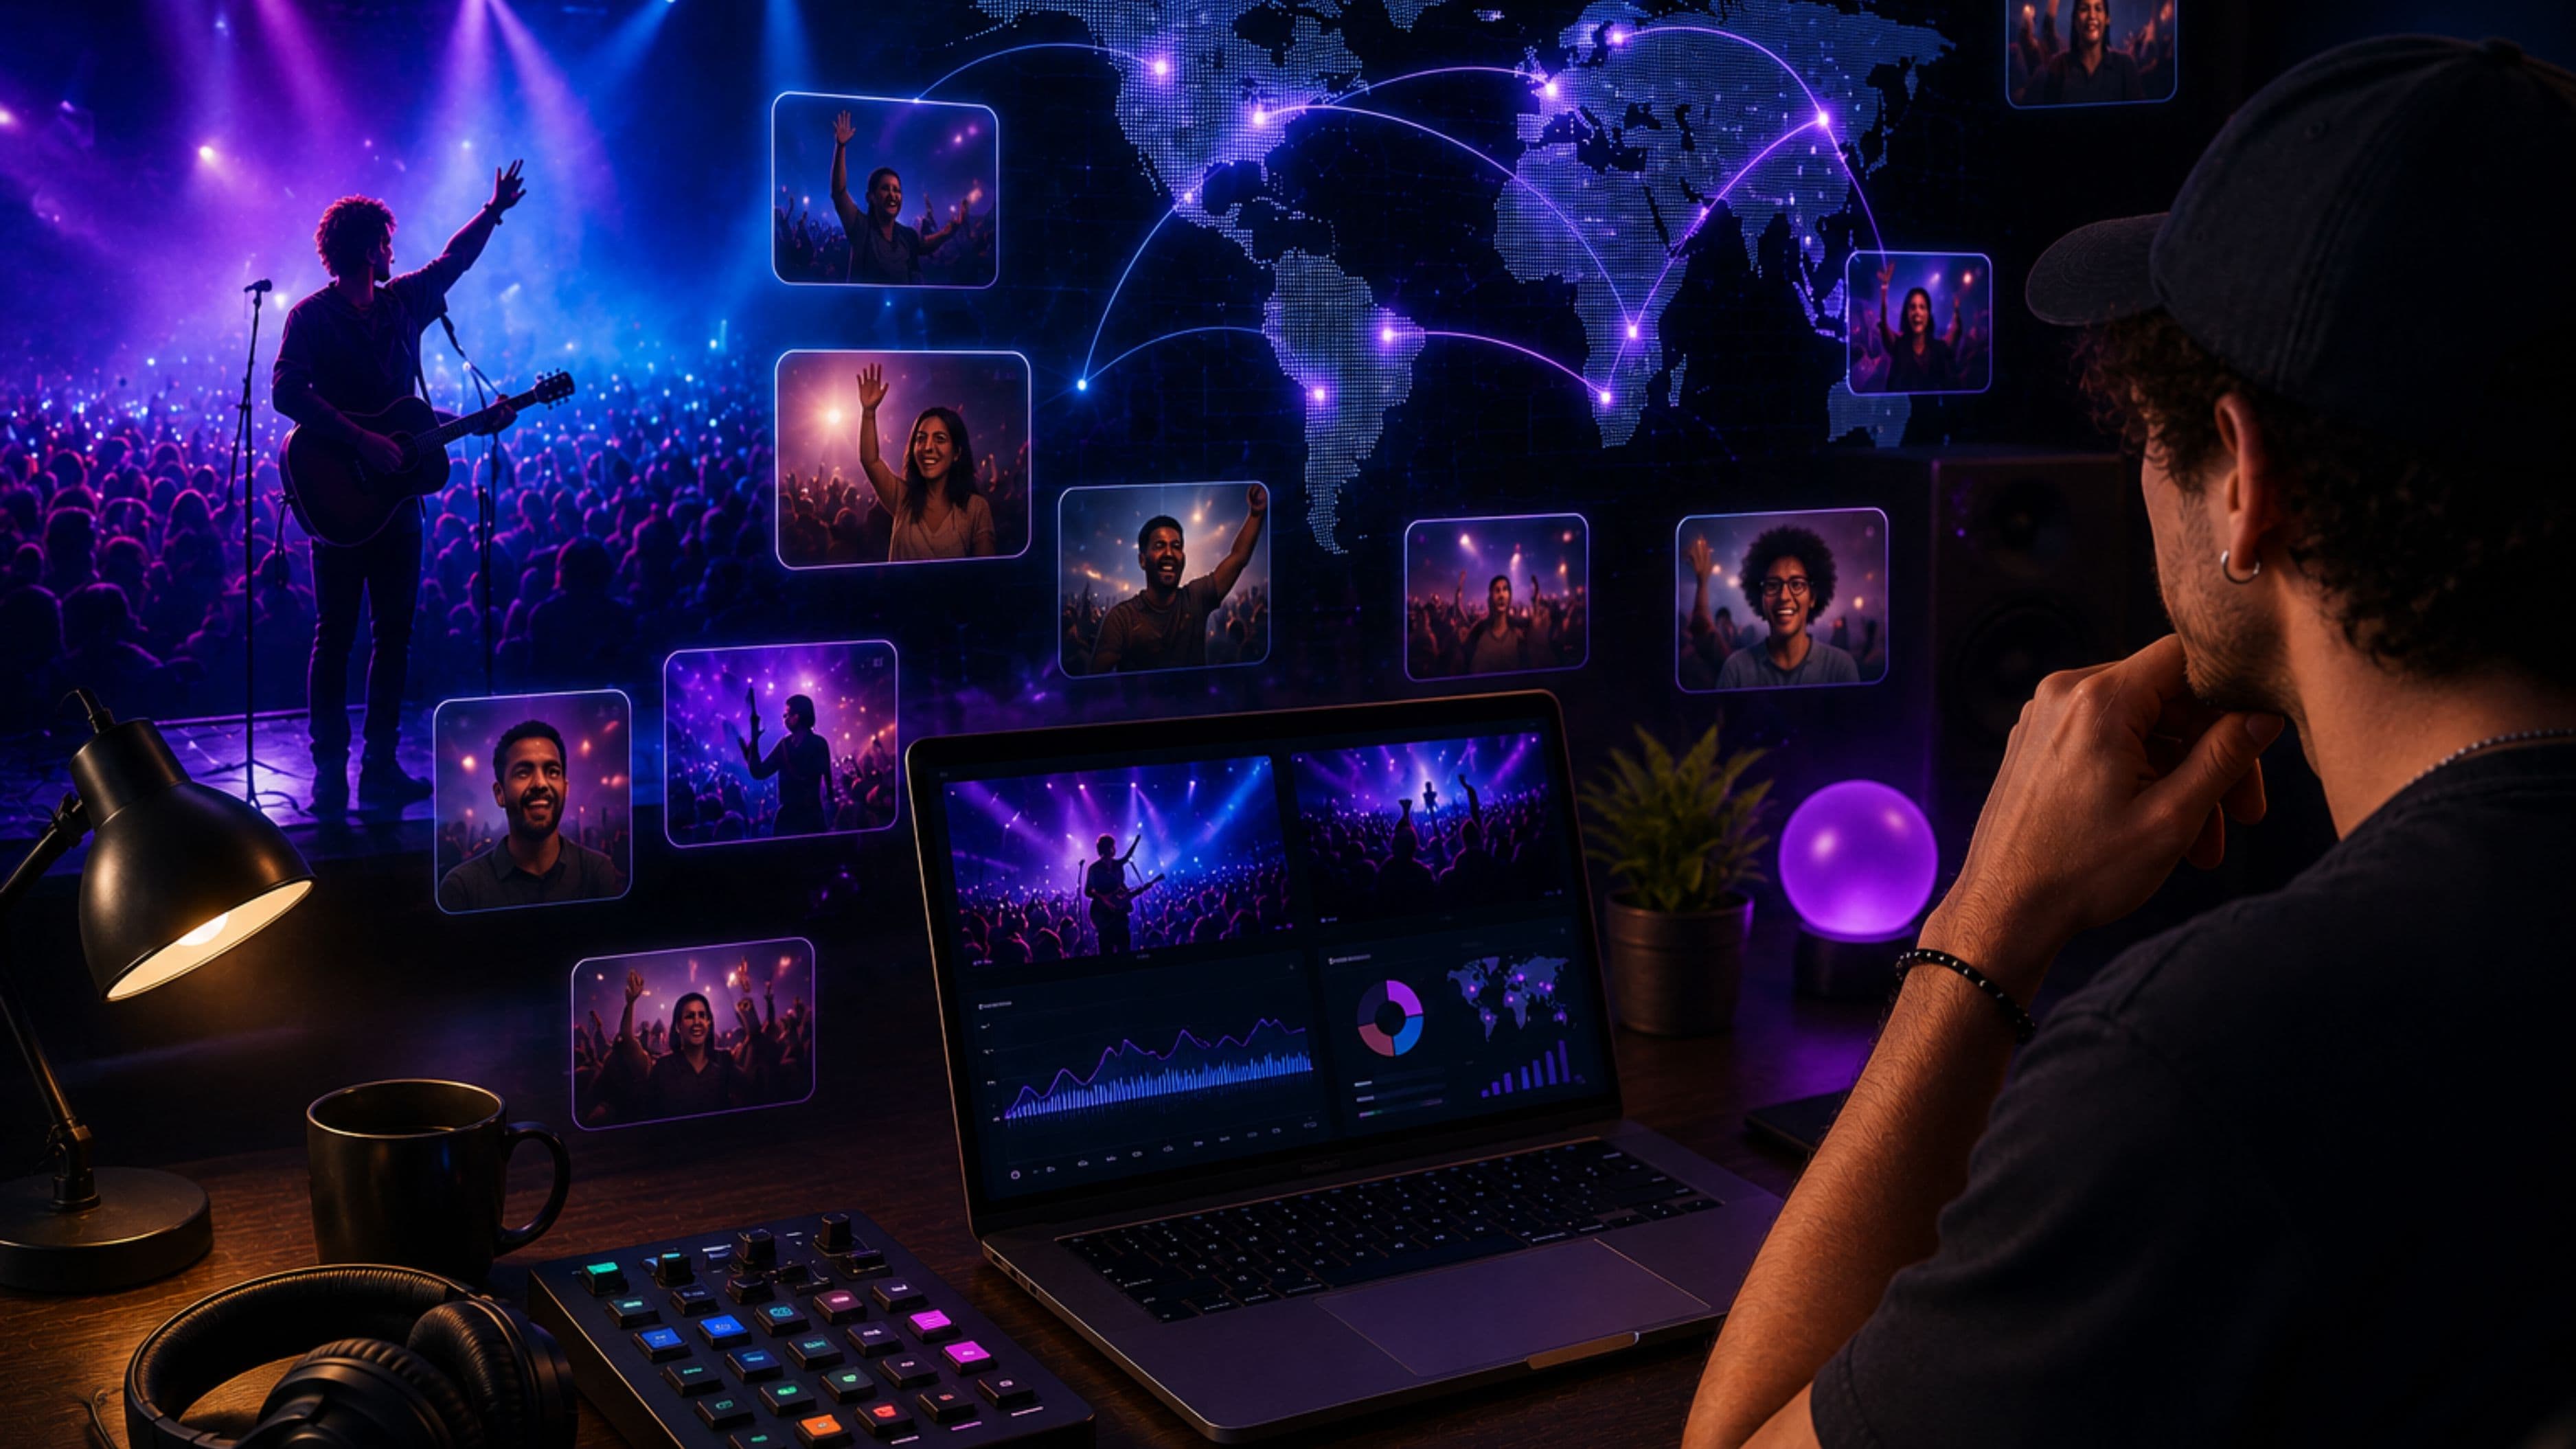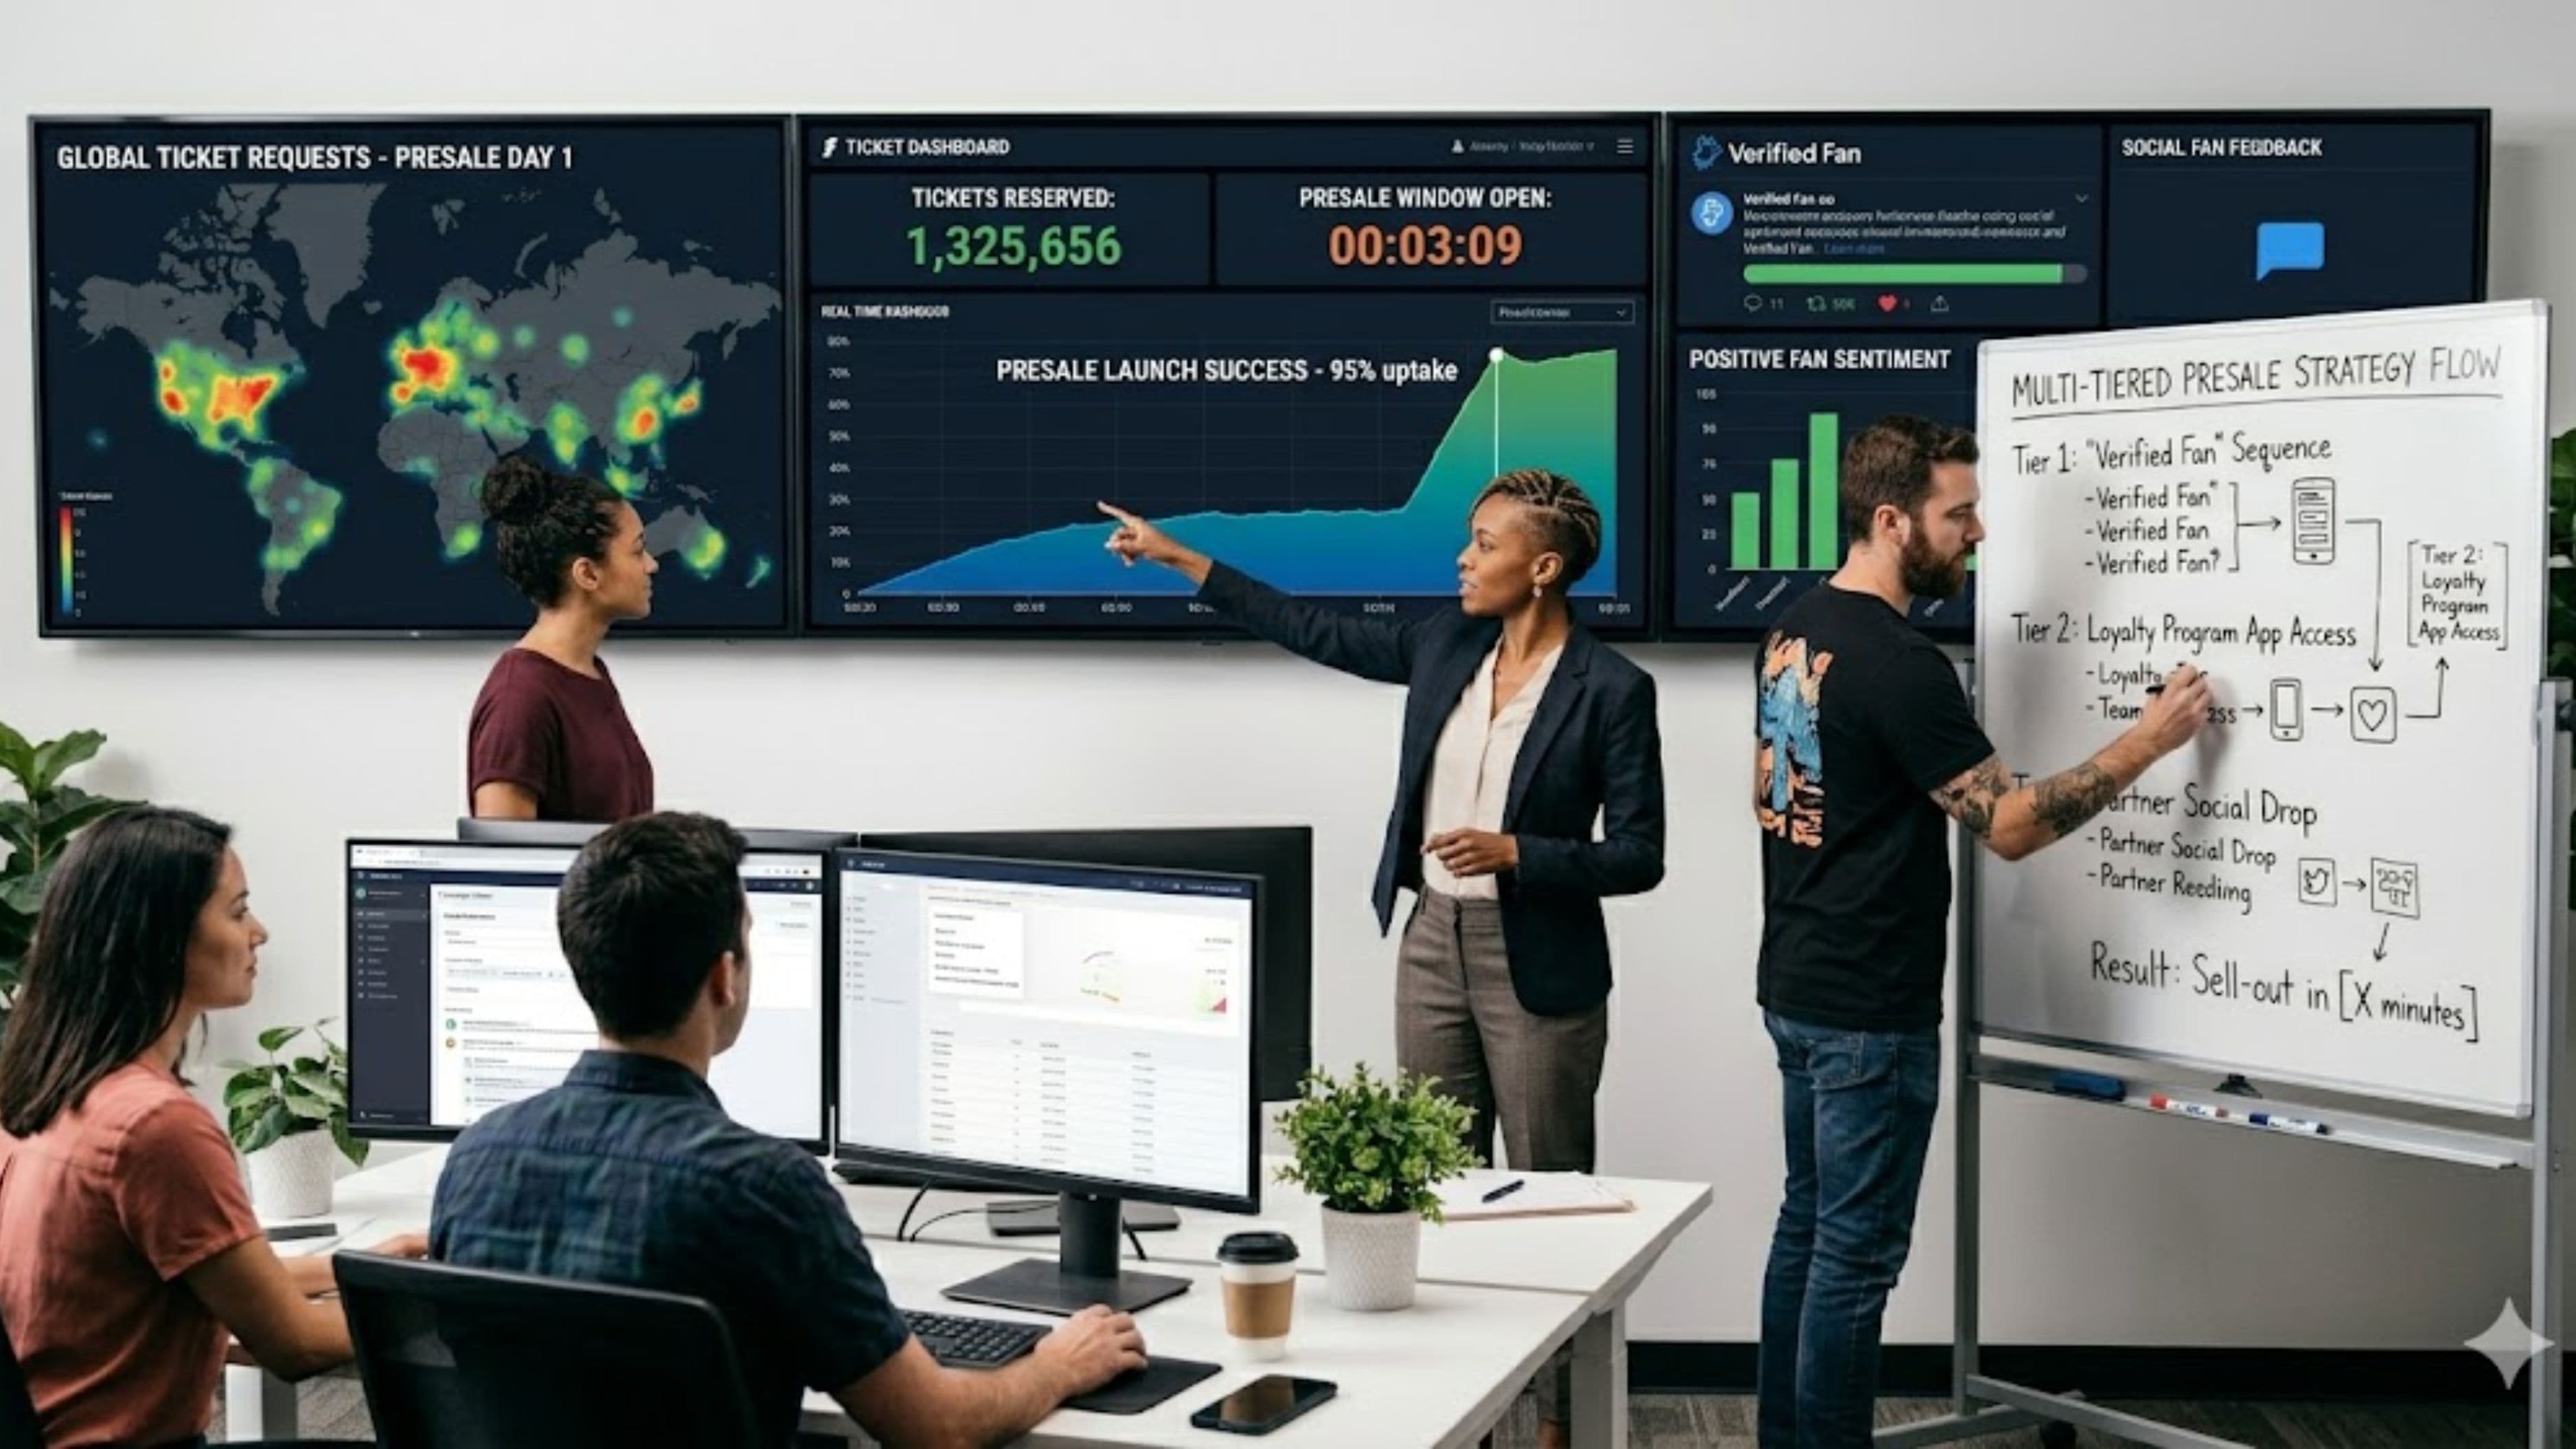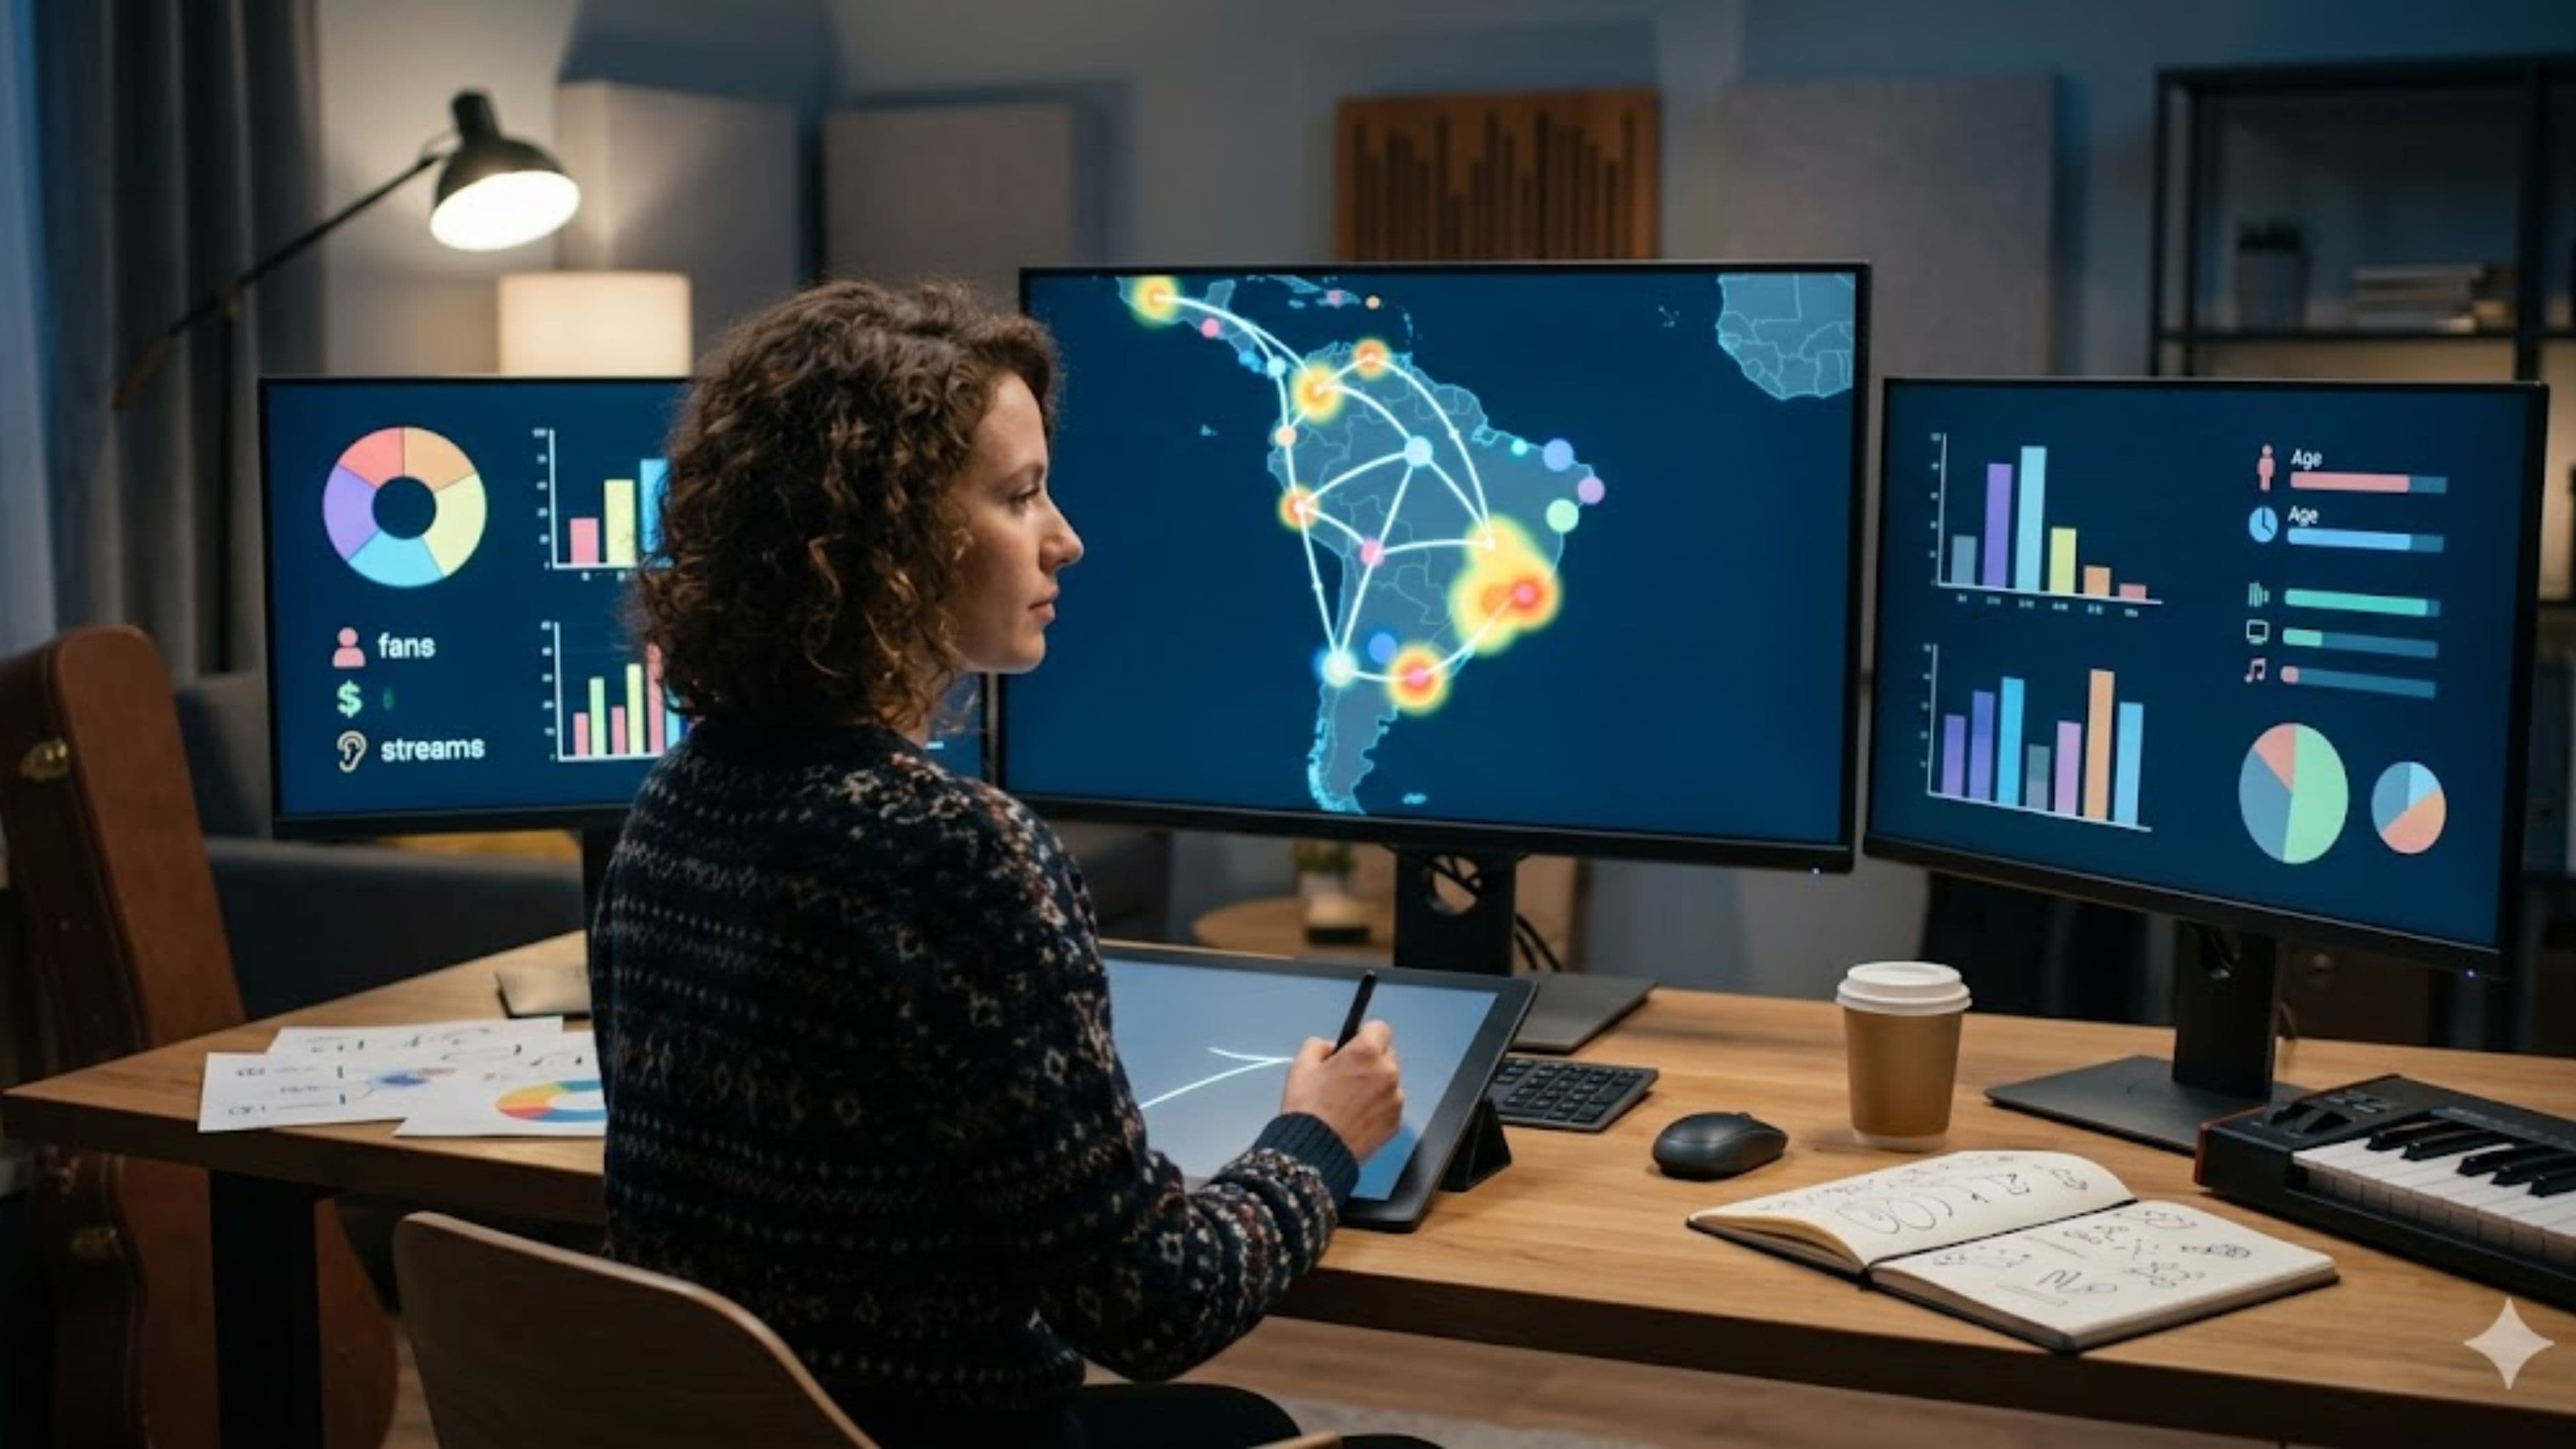
Fan data has become one of the most useful strategic tools available to independent artists, and touring is where the ROI is most direct and measurable. Getting in front of the right audiences in the right cities generates revenue, builds local fanbase density, and compounds into the kind of regional momentum that makes the next tour more profitable than the last one. Ignoring the data doesn't just mean leaving money on the table – it often means booking shows that quietly drain resources and morale.
Where the Data Actually Lives
The first thing to understand is that useful fan location data already exists for most artists who have been releasing music and building an online presence. It doesn't require expensive research or third-party analytics firms. The primary sources are platforms most artists are already using.
Spotify for Artists provides demographic and geographic breakdowns of your listeners, including the cities where your monthly listeners are most concentrated. The "Audience" tab shows you a ranked list of cities by listener count, updated regularly. This is the clearest signal of where people are already listening to you, and it's often the first and most reliable place to look when assessing which markets have genuine demand. An artist with 40,000 monthly Spotify listeners might assume their fanbase is concentrated near their home city, then discover that three of their top five cities are in regions they've never played.
Apple Music for Artists provides similar geographic data, as does the Amazon Music analytics dashboard. YouTube Studio shows viewer location data that's particularly useful for artists whose fanbase developed through video content rather than streaming. Instagram and TikTok both provide geographic breakdowns of followers and content reach, which matters because social media concentration and streaming concentration don't always match – some markets have strong streaming numbers but weak social engagement, and the inverse is also true.
Bandcamp, for artists who sell music or merchandise directly, provides purchase geography that's arguably the most signal-rich data of all. Someone who paid money to support you is a different kind of fan than a passive listener. A city where you have 200 Spotify listeners and three Bandcamp purchases sends a different touring signal than a city where you have 2,000 Spotify listeners and zero purchases.
How Platforms Are Making This Easier
Beyond raw data from individual platforms, a set of dedicated tools has emerged specifically to help artists translate fan data into touring decisions.
Spotify's Concerts tool and the streaming platform's integration with ticketing infrastructure has made geographic demand more visible than ever. Artists who have joined Spotify's promotional programs can see data on fan location relative to upcoming tour dates, which allows pre-tour marketing to be directed at markets with the highest concentration of potential ticket buyers.
Bandsintown and Songkick collect demand signals from fans who actively mark themselves as interested in seeing an artist live. When a fan clicks "I want to see this artist" on either platform, that signal is recorded and aggregated by location. Artists with access to their Bandsintown or Songkick dashboards can see ranked lists of cities where fans have expressed explicit live show demand – a metric that's arguably more useful than passive listening data because it reflects active intent.
BandsInTown's Artist Dashboard provides a "Fan Demand" view showing you geographic demand concentration across markets you haven't yet played, which is essentially a pre-qualified list of cities where shows are most likely to sell. This is significantly more reliable as a booking signal than trying to extrapolate from streaming numbers alone.
Chartmetric is a more comprehensive analytics aggregator used by both independent artists and larger management teams. It pulls data from across streaming platforms, social media, radio, and playlisting to build a multi-dimensional picture of where an artist's presence is strongest. For an artist trying to understand the difference between markets where they have strong streaming numbers versus markets where they have broad cross-platform presence (and are therefore better positioned to sell tickets), Chartmetric's geographic filtering is a genuinely useful tool.
Reading the Data Strategically
Having access to fan location data is the first step. Knowing how to interpret it for touring decisions is a different skill, and it's one where artists frequently make avoidable mistakes.
The most common error is treating high listener counts in a city as a direct proxy for ticket-selling potential. Streaming numbers in a market reflect how many people are hearing your music, not how many of them know who you are or how committed they are as fans. A city where you have 8,000 monthly Spotify listeners might convert very differently to ticket sales depending on whether those listeners came from playlist placement (passive, low-commitment exposure) or from organic search and repeat listening (active, high-commitment engagement). The depth of fanbase matters as much as its size.
Cross-referencing multiple data sources before making a decision about a market is the more reliable approach. A city that ranks highly on Spotify listeners, has meaningful Bandcamp purchase geography, and shows up in your Bandsintown fan demand data is a much stronger touring candidate than a city that only appears in one of those sources. Confluence across data points is the signal; appearance in just one source might be noise.
It's also worth distinguishing between markets where you already have fanbase density and markets where you're trying to build it. Touring to cities where the data says fans already exist tends to produce more immediate ticket revenue. Touring to markets where you have weak data but strong demographic fit – cities where artists with similar aesthetics and fanbases have done well – is more speculative but can be the right long-term move if it's resourced appropriately and the expectation is building rather than immediate returns.
Real-World Application: Planning a Regional Route
Here's how this process looks in practice for an independent artist planning their first significant tour.
Start by pulling your top 20 cities from Spotify for Artists. Note the cities where the listener count is meaningfully above what you'd expect based on shows you've already played there – these are organic demand markets where your music has reached people without direct promotion. Cross-reference those cities against your Bandsintown fan demand data and any purchase geography you have from Bandcamp or direct sales.
From that combined picture, identify your highest-confidence cities – places where the data converges across sources and where the fanbase seems both large enough and engaged enough to support a ticket-buying audience. These are your anchor markets. Build the route geography around them and look at what intermediate cities make geographic and logistical sense to add based on routing efficiency – a tour that hits five cities in a sensible geographic cluster costs meaningfully less in travel and lodging than one that jumps unpredictably across regions.
Look at the capacity level that's appropriate for each market based on the data. An artist whose Spotify data shows 3,000 monthly listeners in a city is not yet positioned to fill a 300-cap room in that market. A 75 to 100-cap room might be appropriate, with the goal of building fanbase density that makes a larger room viable on the next cycle. Booking oversized venues based on optimistic readings of the data is one of the most consistent ways tours become financially damaging.
The Promotional Layer
Fan data doesn't just inform which cities to play – it also tells you where to spend your touring promotional budget. Digital advertising geotargeted to the cities on your tour route performs significantly better when the targeting is refined to zip codes or neighborhoods where your existing listeners are concentrated, rather than the entire metro area.
Meta and Instagram ads with location targeting down to a specific city, combined with custom audiences built from your Instagram or Facebook follower geography, allows promotional spend to reach people who are already pre-warmed to your music rather than cold audiences. The conversion rate on ticket sales from fans who already follow you and live near a tour date is dramatically higher than conversion from cold audiences, which is why retargeting existing fans in tour markets is generally the highest-ROI promotional approach for independent artists.
Spotify's own advertising tools allow for geographic targeting that can align with your listener data in specific markets. Reaching people who have already listened to your music in a city where you're playing, with an ad announcing that you're coming to that city, is about as targeted as independent artist promotion gets.
What to Watch Out For
Data can give a false sense of confidence in markets where the numbers look strong but the actual touring infrastructure doesn't support a successful show. A city with 5,000 Spotify listeners but no suitable venue at the right capacity level, weak local promoter infrastructure, or unfavorable timing relative to competing shows is a harder market to execute well regardless of what the data says.
Over-relying on streaming data while ignoring social media engagement is a common analytical gap. An artist whose listeners are largely driven by editorial playlist placement often has high streaming numbers in cities where almost no one would recognize their name or buy a ticket. The engagement quality of your fanbase matters as much as its size, and social media metrics – comment rates, saves, direct messages, story replies – are often better proxies for genuine fan commitment than stream counts.
Building a tour purely around data without consulting with local promoters and agents who know the nuances of specific markets is also a mistake. Data tells you where demand exists; it doesn't tell you whether a specific venue is the right fit, whether a competing event is already announced for the same weekend, or whether a particular city's scene is currently favorable for your genre. Data informs the decision – it doesn't replace local knowledge.
FAQ
What if I don't have much data yet as a newer artist? Start with whatever you have. Even 500 Spotify listeners distributed across cities tells you something about where your music is reaching people. Bandsintown demand data accumulates quickly once fans start using the platform to track you. For artists with very limited data, looking at where artists with similar sounds and audiences have toured successfully is a reasonable proxy while you build your own data foundation.
How many cities of data do I need before touring makes sense? There's no universal threshold, but a practical minimum is having meaningful listener or demand concentration in at least three to four cities within a geographically sensible route. A tour built around fewer confirmed-demand markets than that tends to be more speculative and financially riskier than touring is worth at an early stage.
Should I tour markets where the data is weak but I have a connection (friends, family, a college I attended)? These personal connections can genuinely supplement data-backed markets as low-risk "anchor" shows where your personal network provides a floor audience. They shouldn't drive the route – but adding a hometown or college show to a data-informed route is a reasonable way to lower the financial risk of a first tour while building experience.
How frequently should I re-pull data between tours? Monthly is sufficient for most artists, with a more thorough data review three to four months before booking a tour. Streaming and fan location data shifts as your music reaches new audiences, and what's true of your listener geography six months ago may look meaningfully different by the time you're booking the next cycle.
Is Chartmetric worth the cost for an independent artist? It depends on your scale. Chartmetric's paid plans start around $10 to $20 per month and provide value once you're at a scale where multi-platform data comparison matters for decision-making. Artists early in their growth phase can likely get most of what they need from the free tiers of Spotify for Artists, Bandsintown, and platform-native analytics before investing in an aggregator tool.
📚 Sources
Spotify for Artists. Understanding Your Audience Data. https://artists.spotify.com/en/help/article/audience
Bandsintown. Artist Dashboard and Fan Demand Overview. https://manager.bandsintown.com
Songkick. Artist Tracking and Demand Data. https://www.songkick.com/artist-signup
Chartmetric. Geographic Analytics for Artists. https://www.chartmetric.com/features
MusicWatch. Live Music Attendance Trends 2024. https://www.musicwatchinc.com/blog/live-music-2024/
Hypebot. How Independent Artists Can Use Data to Book Better Tours. https://www.hypebot.com/hypebot/2023/05/how-independent-artists-can-use-data-to-book-better-tours.html
Music Business Worldwide. The Rise of Data-Driven Artist Management. https://www.musicbusinessworldwide.com/the-rise-of-data-driven-artist-management/
Pollstar. Regional Touring Economics for Independent Artists. https://www.pollstar.com
DIY Musician (CD Baby Blog). How to Plan a Tour Using Fan Data. https://diymusician.cdbaby.com/musician-tips/how-to-plan-a-tour-using-fan-data/
Bandzoogle. Independent Artist Touring Strategy. https://bandzoogle.com/blog/touring-strategy-independent-artists