

Spotify stream velocity measures how fast listens accumulate relative to your baseline—not just whether a track is growing, but whether it is accelerating, plateauing, or decaying faster than comparable releases. Teams that monitor velocity windows catch algorithmic lift on day four instead of discovering it in a month-end PDF. Velocity turns static stream totals into an early-warning system for creative, marketing, and playlist strategy.
This article defines velocity formulas, compares measurement windows used by indie labels and major distributors, and shows how to read decay curves when playlist support ends.

Velocity is a rate-of-change metric—check it daily during release fortnight.
Velocity as a Live Signal
Before formulas and window tables, treat velocity as a live signal desk—streams rising, flattening, or decaying in motion. The clip below is atmospheric context for the measurement framework that follows; use it as a mental model for reading dashboards, not as a data source.
Signal desk — acceleration, plateau, and decay as a live streaming pulse.
Defining Stream Velocity on Spotify
Stream velocity is streams per unit time, adjusted for context. The simplest version is daily streams. A more useful version is daily streams divided by your trailing thirty-day catalog average, producing an index where 1.0 means "normal" and 2.5 means "two and a half times hotter than usual."
Another formulation tracks the first derivative: today’s streams minus yesterday’s streams. That highlights acceleration. A track doing fifty thousand streams daily but flat day-over-day is high volume with zero velocity—often a playlist holding it in place rather than organic momentum.
Velocity vs Growth Rate
Growth rate is percentage change; velocity is absolute or indexed speed. A track moving from one hundred to two hundred daily streams shows one hundred percent growth but still low absolute velocity. A track moving from eighty thousand to ninety-six thousand shows only twenty percent growth but massive commercial velocity. Use both when reporting to stakeholders with different math comfort levels.
Measurement Windows and When to Use Them
Different windows answer different questions. Pick the window before you look at the dashboard so you do not chase noise.
| Window | Best For | Typical Noise Level | Decision It Informs |
|---|---|---|---|
| 24-hour | Release day pulse | High | Whether launch assets fired |
| 48-hour rolling | Playlist pickup | Medium-high | Pitch follow-ups to curators |
| 7-day average | Algorithmic seeding | Medium | Scale or hold ad spend |
| 14-day slope | Post-playlist decay | Low-medium | Catalog marketing budget |
| 28-day compound | Long-tail forecast | Low | Tour routing, sync pitches |
| 90-day baseline | Catalog health | Very low | Whether to re-record or remix |
During the first fourteen days, prioritize forty-eight-hour and seven-day windows. After day thirty, shift emphasis to fourteen- and twenty-eight-day slopes so daily jitter does not distract.
Reading the Decay Curve
When editorial playlist support ends, streams rarely drop to zero overnight—they decay along a predictable curve. Understanding your decay constant helps you budget retargeting ads.
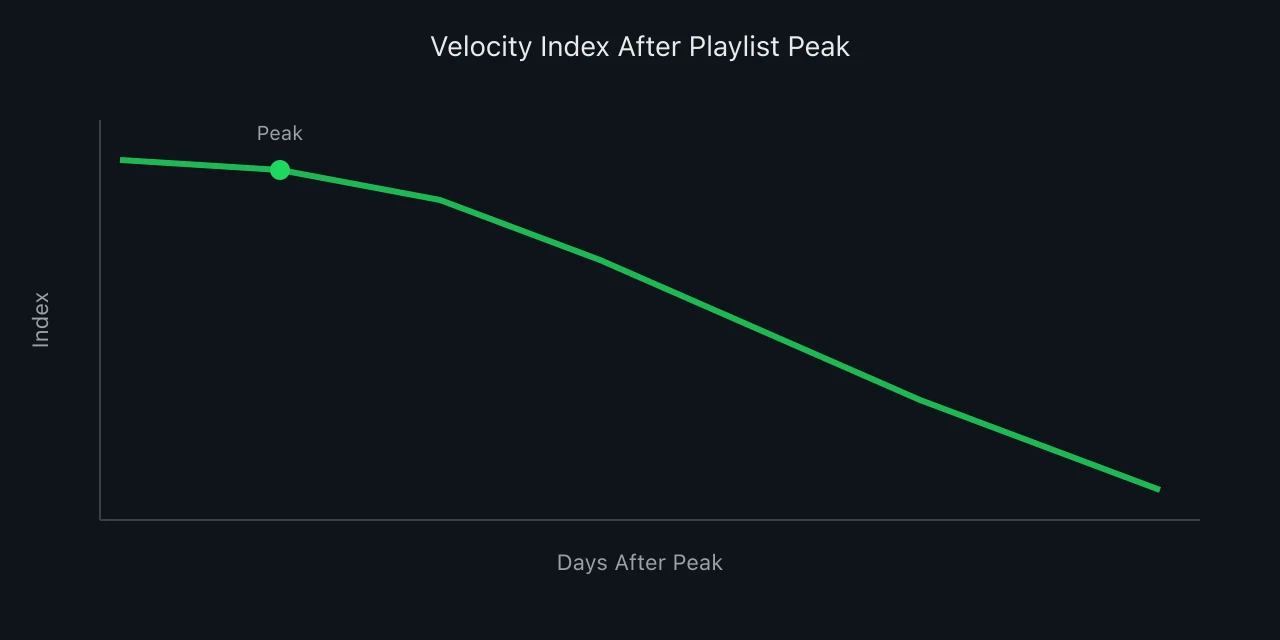
Stream velocity decay curve
A shallow decay curve—velocity still above 0.6 at day twenty-one—usually means algorithmic radio and saves are backfilling playlist loss. A cliff to below 0.3 within ten days means the track failed to convert passive listeners into fans.
Building Your Catalog Velocity Index
Compute a trailing thirty-day average daily stream count across active tracks (exclude back-catalog deep cuts below one hundred weekly streams). That average is your baseline. For any focus track, divide its current seven-day average daily streams by the baseline to get velocity index.
Store index readings daily in a spreadsheet. Chart the index for the first forty-five days after each release. Overlay playlist add dates and marketing spend bands. After five releases you will see whether your typical index peaks on day three or day nine—valuable for staffing social content.
Normalizing for Seasonality
December streams inflate globally; late July often softens in Europe. Compare velocity index against the same calendar window on prior releases rather than against the prior month of catalog averages when seasonality is extreme.
Velocity Triggers for Marketing Action
Define internal triggers so debates shrink. Example policy: if seven-day velocity index exceeds 1.8 before day ten and save rate holds above catalog median, increase Meta retargeting budget twenty percent. If index falls below 0.9 for three consecutive days before day fourteen, pause cold-audience ads and ship a vertical video hook test.
Velocity triggers should never override creative instinct entirely—they prevent both panic cuts on healthy decay and reckless scaling on playlist vanity spikes.
Separating Playlist Velocity from Organic Velocity
When a track lands on a major editorial list, velocity spikes artificially. Pull playlist-attributed streams from Spotify for Artists source data and compute velocity on the remainder. Organic velocity alone reveals whether recommendation systems picked up the song.
Some teams log "playlist dependency ratio"—playlist streams divided by total streams at day seven. A ratio above seventy percent with declining organic velocity is a fragile hit. Below forty percent with rising organic velocity is a healthier foundation.
Case Study: Hip-Hop Single with Delayed Lift
An independent rapper released on a Friday with no editorial support. Days one through four showed velocity index between 0.7 and 0.9—soft. On day five, a mid-size user-generated playlist added the track. Velocity index jumped to 1.4 by day seven. Crucially, organic velocity (excluding that playlist) rose from 0.8 to 1.1 simultaneously, suggesting Spotify's radio had begun testing the record in similar sessions.
By day twelve, index peaked at 2.1 before decaying toward 1.3 by day twenty-one—a shallow curve. The team increased ad spend on day eight, not day two, aligning spend with confirmed velocity rather than hope.
Velocity and Distributor Reporting Delays
Distributor dashboards often lag Spotify for Artists by twenty-four to seventy-two hours. For velocity, use the fastest source for operations and reconcile weekly for royalty forecasting. Mismatched timestamps create phantom acceleration or false decay.
According to music streaming industry history, real-time analytics expectations rose as platforms competed on artist tools—velocity is a product of that shift toward daily operations tempo.
Comparing Velocity Across a Roster
Label managers chart velocity index for all active singles on one axis. Tracks in the top quartile get playlist pitching resources; bottom quartile gets creative postmortems before more money burns. This roster view prevents a single vanity spike from hiding three underperforming releases.
Normalize by marketing spend where possible: velocity per thousand dollars of ads reveals efficiency, not just hype.
Advanced Signals: Second Derivative and Half-Life
Power users track the second derivative—whether velocity itself is increasing. Positive second derivative during days five through ten strongly correlates with eventual algorithmic playlist inclusion in independent catalog samples.
Half-life measures days for velocity index to drop fifty percent from peak. Catalogs with median half-life above eighteen days tend to show stronger sync and touring tail. Half-life below ten days suggests the track relied on a single placement.
Operational Rhythm for Release Teams
Assign a daily velocity owner during release fortnight. They post index, organic index, and half-life estimate to Slack each morning. Producers see numbers without drowning in raw streams. Marketing sees triggers fire automatically from agreed rules.
After day forty-five, switch to weekly velocity reviews unless a re-push campaign launches. Long-tail maintenance rarely needs daily granularity.
Common Velocity Mistakes
Chasing daily noise. One viral TikTok clip can triple a day then fade—use seven-day averages before reacting.
Ignoring timezone release. Global release at midnight local stagger creates artificial velocity stair-steps; align windows to primary market.
Comparing unlike genres. Dance singles spike faster than singer-songwriter ballads—benchmark against genre cohort velocity, not roster-wide averages.
Forecasting Monthly Streams from Velocity Slope
Once you have fourteen days of index readings, fit a simple linear trend on organic velocity index. Extrapolate cautiously—curves rarely stay linear past week three—but the exercise produces a band of outcomes for finance planning. If slope is positive and index remains above 1.2 at day fourteen, a mid-tier indie single often lands between three hundred thousand and eight hundred thousand streams by day ninety.
Document forecast error after day ninety. Teams that review error quarterly improve triggers and spend timing measurably over two release cycles.
Presenting Velocity in Label and Artist Meetings
Artists understand "we are moving faster than last single" better than raw six-figure stream counts. Lead with index and decay curve visuals. Explain playlist dependency ratio before discussing ad budget. When an artist sees organic velocity rise while playlist share falls, they understand the algorithm is adopting the song—even if total streams dipped slightly.
Avoid comparing velocity across unrelated artists on the roster in front of sensitive creatives; use genre cohort language instead.
Setting Up a Velocity Dashboard
Start with a simple Google Sheet or Notion database: one row per track per day. Columns include date, total daily streams, playlist-attributed streams, organic streams, seven-day rolling average, velocity index, and notes (playlist adds, ad flights, press hits). Pull Spotify for Artists data each morning before standup.
Color-code rows where velocity index crosses thresholds you defined with your team. Green above 1.5 in week one, yellow between 0.9 and 1.5, red below 0.9 for three consecutive days. Visual cues reduce debate time when five singles are live simultaneously.
Automating Data Pulls
Chartmetric, Soundcharts, and Spotify's own API (for approved partners) can automate daily ingestion. If budget is tight, manual entry for fourteen days is still worthwhile—the discipline of looking daily changes outcomes more than perfect automation.
Velocity for Catalog Tracks, Not Just New Releases
Catalog velocity reveals which older songs deserve refreshed playlist pitches or sync pushes. A deep cut whose velocity index rises during tour month without new marketing may be catching on via TikTok or Shazam. Flag those tracks for spotlight campaigns.
Conversely, catalog velocity that flatlines below 0.2 for ninety days may still earn meaningful annual revenue—do not delist—but should not receive paid media until a remix or acoustic version tests new creative.
Cross-Platform Velocity Context
Spotify velocity leading Apple Music and YouTube Music by a wide margin suggests playlist or algorithmic strength specific to Spotify. If all platforms accelerate together, you likely have a cultural moment—scale creative output, not just ads. Divergent velocity across platforms should inform where you send paid traffic.
Velocity Action Plan Summary
Define windows, build a baseline index, chart decay, separate playlist from organic, set spend triggers, and log half-life for every release. Spotify stream velocity is not a vanity flex—it is the pace at which the market chooses your record. Measure it with discipline and you will know when to push, when to hold, and when to pivot before the quarter ends.
Velocity Spreadsheet Template
Column A: date. Column B: track name. Column C: daily streams. Column D: seven-day rolling average. Column E: catalog baseline average. Column F: velocity index (D divided by E). Column G: organic streams if sourced separately. Column H: organic velocity index. Column I: notes on external events. Conditional formatting on column F highlights cells above 1.5 green and below 0.85 red for three-day streaks.
Share read-only access with marketing so they see the same index producers see—alignment prevents "why did we cut ads?" arguments when decay was predictable from the curve.
Smoothing Noisy Daily Data
Raw daily streams jump on Fridays globally. Use seven-day rolling averages for index denominators and numerators unless you are diagnosing a specific Thursday playlist add. Some teams keep both daily and smoothed columns to separate operational response from strategic trend reading.
Velocity and Release Radar Interactions
Release Radar fires for followers and recent engagers. When velocity index rises among followers first, organic velocity often follows within forty-eight to ninety-six hours as the algorithm tests similar listeners. Track follower-sourced stream velocity separately if your distributor exposes it—follower velocity leading cold velocity is a healthy pattern.
If cold velocity rises while follower velocity flatlines, you may be riding playlist or viral traffic without converting profile follows—pair with profile conversion tactics before celebrating index peaks.
Multi-Track Roster Prioritization
When six singles are live, rank by velocity index times save rate index to allocate playlist pitching hours. A track at index 1.9 with weak saves is a false priority; a track at 1.3 with strong saves deserves the next editorial follow-up. Velocity alone misallocates resources on passive playlist spikes.
Weekly roster standups should open with this ranked list, not with whoever shouts loudest about stream totals.
Historical Velocity Archives
Archive index curves for every release in a shared drive folder named by ISRC. New A&R hires study five archived curves in their first week to internalize what healthy decay looks like for your genre. Institutional memory beats reinventing triggers every quarter.
Compare archive half-lives year over year. Lengthening median half-life across comparable releases suggests improving creative, growing follower base, or better playlist-to-algorithm handoffs—or some combination worth decomposing in annual review.
Release Calendar Velocity Planning
Stagger roster releases so two priority singles do not compete for the same velocity baseline window. When two tracks share a baseline, index readings distort. Calendar planning is analytics hygiene—avoid launching siblings within seven days unless one is catalog and one is frontline.
Black Friday and year-end playlist surges lift baselines globally. Note calendar events on your velocity dashboard legend so October releases are not compared naively to January decay curves.
Velocity Communication With Artists
Translate index into plain language: "We are moving 1.6 times faster than our normal song at this stage." Artists grasp relative pace faster than derivatives. Show the decay SVG in updates so visual learners see playlist handoff stories without reading spreadsheets.


